25.1 Green's Theorem
Examples
Example 25.1.1
Evaluate the line integral
 , where C is the boundary of the region in the first quadrant fenced by
 ,
,
![]() and
and
![]() oriented in counterclockwise direction. First evaluate the integral directly, then use Green's theorem.
oriented in counterclockwise direction. First evaluate the integral directly, then use Green's theorem.
To answer part a, we code the vector field, parametrize the boundaries and visualize the region.
| > | F:=map(unapply, [x^2+y^2+1, 2*x+y], (x, y)); r1:=[t, t^2]; r2:=[t, 4]; r3:=[0, t]; |
![]()
![]()
![]()
![]()
| > | plot([[op(r1), t=0..2], [op(r2), t=2..0], [op(r3), t=4..0]], color=[red, blue, green], axes=frame); |
![[Maple Plot]](images/Lesson_259.gif)
The integral is now readily evaluated.
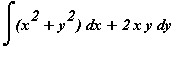
| > | e1:=Int(dotprod(F(r1[1], r1[2]), map(diff, r1, t), orthogonal), t=0..2)+Int(dotprod(F(r2[1], r2[2]), map(diff, r2, t), orthogonal), t=2..0)+Int(dotprod(F(r3[1], r3[2]), map(diff, r3, t), orthogonal), t=4..0); |
| > | answer:=value(e1); |
![]()
As solution to part b, we apply Green's theorem.
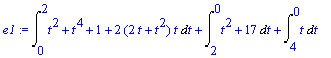
| > | a1:=Doubleint(diff(F(x, y)[2], x)-diff(F(x, y)[1], y), y=x^2..4, x=0..2); |
| > | check:=value(a1); |
![]()
| > |
Example 25.1.2
If
![F = [x^3*y, x^4+x*y^2]](images/Lesson_2514.gif) , compute a decimal approximation for the integral
, compute a decimal approximation for the integral
 along the positively oriented curve
 .
.
Code the vector field, the integration curve and make a picture.
| > | F:=[x^3*y, x^4+x*y^2]; c:=x^4+y^4=1; |
![]()
![]()
| > | p1:=fieldplot(F, x=-1..1, y=-1..1, arrows=THICK, color=blue): |
| > | p2:=implicitplot(c, x=-1..1, y=-1..1, thickness=3): |
| > | display([p1, p2], scaling=constrained, axes=frame); |
![[Maple Plot]](images/Lesson_2519.gif)
Because it is non-trivial to parametrize this curve, Green's theorem provides a welcome alternative solution.
| > | bnd:=solve(c, y); |
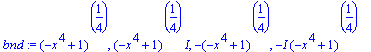
| > | e1:=Doubleint(diff(F[2], x)-diff(F[1], y), y=bnd[3]..bnd[1], x=-1..1); |
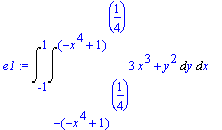
| > | answer:=evalf(e1); |
![]()
| > |
Example 25.1.3
Compute the area of the region bounded by the closed curve
![r = [cos(t)^3, sin(t)^5]](images/Lesson_2523.gif) , 0 <= t <= 1.
, 0 <= t <= 1.
| > | r:=[cos(t)^3, sin(t)^5]; |
![]()
| > | plot([op(r), t=0..2*Pi]); |
![[Maple Plot]](images/Lesson_2525.gif)
We will use Green's theorem in reverse, with
![]() =
=
![]() =
=
![]() to obtain that the area of this region equals
to obtain that the area of this region equals
 =
=
 . Where the latter denotes the line integral over the positively oriented boundary of the region.
| > | Q:=(x, y)->x; |
![]()
| > | e1:=Int(Q(r[1], r[2])*diff(r[2], t), t=0..2*Pi); |
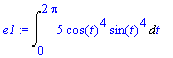
| > | answer:=value(e1); |
![]()
| > | evalf(answer); |
![]()
| > |