Math 173

Calculus I

Spring 2004

Dr. Constant J. Goutziers

Department of Mathematics, Computer Science and Statistics

goutzicj@oneonta.edu

Lesson 3

One-to-one Functions and Inverse Functions

Initializations

>    restart;
with(plots):

Warning, the name changecoords has been redefined

3.1 One-to-one Functions

A function f with domain A is called one-to-one if no two elements of A have the same image; that is f(x[1]) = f(x[2])  implies that x[1] = x[2] .   This property implies that a horizontal line can intersect a one-to-one function at most once.

Examples

Example 3.1.1
Use the horizontal line test to show that the function
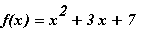
f(x) = x^2+3*x+7  is not one-to-one.

Of course we make a sketch.

>    f:=x->x^2+3*x+7;

f := proc (x) options operator, arrow; x^2+3*x+7 end proc

>    plot(f(x), x=-4..3);

[Maple Plot]

Clearly there are many horizontal lines which intersect with this graph more than once.   y = 9  is an example as can be seen in the next graph.

>    plot({f(x), 9}, x=-4..3);

[Maple Plot]

The function f is therefore not one-to-one.

Example 3.1.2
Use the definition of a one-to-one function to show that
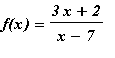
f(x) = (3*x+2)/(x-7)  is one-to-one.

We will show that f(x[1]) = f(x[2])  implies that x[1] = x[2] .

>    f:=x->(3*x+2)/(x-7);

f := proc (x) options operator, arrow; (3*x+2)/(x-7) end proc

>    eq:=f(x[1])=f(x[2]);

eq := (3*x[1]+2)/(x[1]-7) = (3*x[2]+2)/(x[2]-7)

>    test:=solve(eq, {x[1]});

test := {x[1] = x[2]}

>   

3.2  Inverse Functions

Examples

Example 3.2.1
Compute the inverse function of
f(x) = 5*x/(4-3*x) .

We code the equation y = f(x)  and solve for x.

>    f:=x->5*x/(4-3*x);

f := proc (x) options operator, arrow; 5*x/(4-3*x) end proc

>    eq:=y=f(x);

eq := y = 5*x/(4-3*x)

>    finv_y:=solve(eq, x);

finv_y := 4*y/(3*y+5)

>    finv:=subs(y=x, finv_y);

finv := 4*x/(3*x+5)

This Maple  expression can be converted into a Maple  function by using the unapply command.

>    finv:=unapply(finv, x);

finv := proc (x) options operator, arrow; 4*x/(3*x+5) end proc

>   

Example 3.2.2
Consider the function
f(x) = sqrt(x-5) , 5 `` <= `` x `` <= `` 8.
i)     Show that
f   is one-to-one.
ii)    Find the inverse of
f .
iii)   Sketch
f  and its inverse in one picture

i)   We use the horizontal line test.

>    f:=x->sqrt(x-5);

f := proc (x) options operator, arrow; sqrt(x-5) end proc

>    plot(f(x), x=5..8, color=blue);

[Maple Plot]

>   

Clearly no horizontal line intesects with this graph more than once, the function is therefore one-to-one.

ii)  The inverse of f  can be found in the usual way.

>    eq:=y=f(x);

eq := y = (x-5)^(1/2)

>    finv_y:=solve(eq, x);

finv_y := 5+y^2

>    finv:=subs(y=x, finv_y);

finv := 5+x^2

>    finv:=unapply(finv, x);

finv := proc (x) options operator, arrow; 5+x^2 end proc

>   

iii)  When it comes to plotting the functions f  and finv   we have to keep in mind that they have different domains.  Clearly the function f  has [5, 8] as its domain, but the domain of finv  equals the range of f  and is therefore given by [f(5), f(8)] .  In order to handle these different domains we create two separate graphic images, one for f  and the other for finv .

>    p1:=plot(f(x), x=5..8):

>    p2:=plot(finv(x), x=f(5)..f(8), color=blue):

Observe that these statements end with a colon rather than a semicolon.  This prevents premature display of the output.

We now use the display  command to simultaneously show the graphs of f  and finv .  Observe that if we choose equal scales on the coordinate axes, the two graphs are each others mirror image in the line y=x.

>    display([p1, p2], scaling=constrained);

[Maple Plot]

This mirror image property of graphs of inverse functions allows us to quickly sketch the graph of a one-to-one function and its inverse without actually computing that inverse.  To do this we make use of  a parametric plot.

>   

Example 3.2.3
Sketch in one picture the graph of the one-to-one function
f(x) = (x^3+2)^(1/3)  and its inverse.

We use Maple's parametric plot routine and to ensure equal scaling on the coordinate axes we include the scaling=constrained  option.

>    f:=x->x^3+2;

f := proc (x) options operator, arrow; x^3+2 end proc

>    plot({[t, f(t), t=-1.3..1], [f(t), t, t=-1.3..1]}, scaling=constrained);

[Maple Plot]

Of course the line y = x  can easily be added to the picture.

>    plot([[t, f(t), t=-1.3..1], [f(t), t, t=-1.3..1], [t, t, t=-1..3]], color=[red, green, blue], scaling=constrained);

[Maple Plot]

>