CSCI 323 Modeling & Simulation
Project #1: Sensitive Dependence on Initial
Conditions
Date Due: 21
September 2009
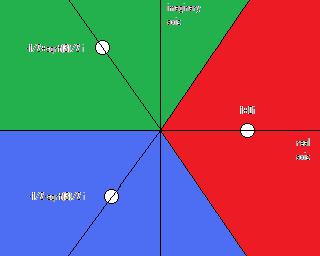
As you
might remember, there are actually THREE cube roots of 1: ![]() (If you don’t believe it, cube each one and see
what you get.) We are going to use
Newton’s method to find the cube roots of 1, starting with various complex
numbers, and determining to which of the three roots that starting value
converges. Depending on which value it
is, we will color that point differently.
For example, if the starting point converges to the first value, color
that point red (0xff0000); if it converges to the second value, color that
point green (0x00ff00); if it converges to the third root, color it blue
(0x0000ff).
(If you don’t believe it, cube each one and see
what you get.) We are going to use
Newton’s method to find the cube roots of 1, starting with various complex
numbers, and determining to which of the three roots that starting value
converges. Depending on which value it
is, we will color that point differently.
For example, if the starting point converges to the first value, color
that point red (0xff0000); if it converges to the second value, color that
point green (0x00ff00); if it converges to the third root, color it blue
(0x0000ff).
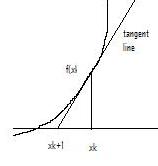
In
case you don’t remember your Newton’s method, it’s fairly simple. We are trying to find the zeroes of a
function, and we make a starting guess.
We plug that value into the function, do the computation, and see what
value we get. If it’s not zero, we
evaluate the derivative of the function at that point to get the slope, and
plot the tangent line. Hopefully, the
intersection of the tangent line with the horizontal line whose value is zero
is a better approximation of the root.
We iterate this process until we get as close as we want to the
root. This process usually converges
fairly rapidly.
For
real functions, we would say ![]() , since we want
value(s) for x that when cubed are equal to 1 (the zeroes of the
function). For a value
, since we want
value(s) for x that when cubed are equal to 1 (the zeroes of the
function). For a value ![]() , the equation of the
tangent line at that point is
, the equation of the
tangent line at that point is ![]() , so for
, so for ![]() , we get
, we get ![]() (assuming
(assuming ![]() ). In general, the formula is just
). In general, the formula is just ![]() . This is the way you do it for real arithmetic…for
complex arithmetic it’s the same basic equation, but you have to use the
complex operators.
. This is the way you do it for real arithmetic…for
complex arithmetic it’s the same basic equation, but you have to use the
complex operators.
Before
running your program, predict what behavior you think you will see. You might think it would look something like
this:
(taking
into account my lack of artistic talent), and you might be right…or you might
be surprised too.
Your
program should ask the user how many pieces to divide the real and imaginary
axes into, and then plot that many points in the range from -1-i to 1+i. You should run your program, capture the
output as a jpeg image, and mail me your source code and the image in a zip
file. Since this is not a graphics
course, here is some sample
code that should help get you started.