Ohio River - 1997 Flood
 Ohio River Flood (31KB JPEG Color Image)
August 22, 1996 Image (62KB JPEG Image)
March 9, 1997 Image (71KB JPEG Image)
March 28, 1997 Image (74KB JPEG Image)
In the spring of 1997 the Ohio River experienced a major flood due to heavy rain (up to 10 inches in one 24-hr period) which occurred in the first week of March over much of the Upper Ohio River Basin. On March 3, 1997 the river reached flood stage at Portsmouth, Ohio approximately 1700 miles (2720 km) upstream from the confluence with the Mississippi River. Although the Ohio River Basin is considerably smaller than the Missouri and the Upper Mississippi basins, the river contributes 70 percent of the water to the lower Mississippi River. When the Ohio River enters into a flood condition, the consequences are generally devastating. The 1997 flood inundated scores of river towns in West Virginia, Ohio, Kentucky, Indiana, and Tennessee resulting in the death of at least 29 people and making tens of thousands of people homeless. According to the U.S. Army Corp of Engineers the river reached 20 feet above flood stage, the highest its been since the 1964 flood.
RADARSAT International was contacted in early March by the Remote Sensing/Geographical Information Center of the U.S. Army Corps of Engineers to determine the availability of radar data over the Ohio River Basin downstream of Cincinnati beginning on March 7, 1997. RSGIC requested the data to support the Federal Emergency Management Agency (FEMA) in assessing the impact of the flood. One image had already been acquired on March 3, 1997, but it was further downstream than the first flood crest. RADARSAT acquired two images, one on Saturday March 8 (1830), and the other on Sunday March 9 (0630). Since radar could penetrate the heavy cloud cover over the basin and can be acquired at any point of the day or night, it had a major advantage over other satellite remote sensing platforms.
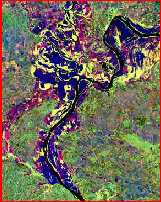
The following images show the flood at the point where the Wabash River enters the Ohio. The false-colored image was developed by bringing together three RADARSAT images acquired before (August 22, 1996), during (March 9, 1997) and after (March 28, 1997) the river had crested. The image covers an area of 33 x 54 miles (53.5 x 87 km). The purple colored areas are flat, floodplain lands which were still under water as of March 28. The red colored areas relate to the March 28 image, a time when the flood was starting to recede. The March 9 image shows many of these areas being flooded. The yellow colored areas represent land, which was not inundated as the purple colored areas. Mount Vernon, Indiana can be seen in the upper right of the image as a small, bright white area on the edge of the river. Shawneetown, Illinois is in the lower left side of the image where a bridge crosses the Ohio.
Copyright: RADARSAT International; Available for Instructional Use.
>Back