INTRODUCTION TO REMOTE SENSING
COPYRIGHT © 2010 Paul R. Baumann
INTRODUCTION
Remote sensing is the art and science of recording, measuring, and analyzing information about a phenomenon from a distance. Humans with the aid of their eyes, noses, and ears are constantly seeing, smelling, and hearing things from a distance as they move through an environment. Thus, humans are naturally designed to be remote sensors. In order to study large areas of the Earth’s surface geographers use devices known as remote sensors. These sensors are mounted on platforms such as helicopters, planes, and satellites that make it possible for the sensors to observe the Earth from above.
PASSIVE AND ACTIVE SENSOR SYSTEMS
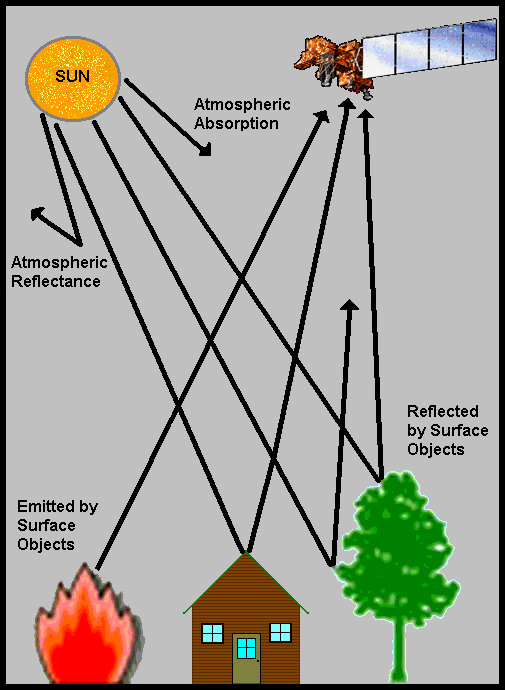
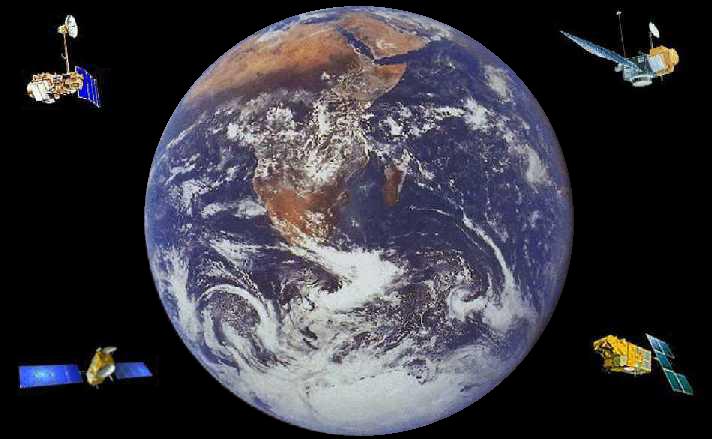
FIGURE 1: Passive System.
Two types of sensors exist, namely passive and active. A passive sensor system needs an external energy source (Figure 1). In most cases this source is the sun. These sensors generally detect reflected and emitted energy wave lengths from a phenomenon. An active sensor system provides its own energy source. As an example, a radar sensor sends out sound waves and records the reflection waves coming back from the surface. Passive systems are much more common than active systems.
Most sensors record information about the Earth’s surface by measuring the transmission of energy from the surface in different portions of the electromagnetic (EM) spectrum (Figure 2). Because the Earth’s surface varies in nature, the transmitted energy also varies. This variation in energy allows images of the surface to be created. Human eyes see this variation in energy in the visible portion of the EM spectrum. Sensors detect variations in energy in both the visible and non-visible areas of the spectrum.
Energy waves in certain sections of the EM spectrum easily pass through the atmosphere, while other types do not. The ability of the atmosphere to allow energy to pass through it is referred to as its transmissivity, and varies with the wavelength/type of the radiation. The gases that comprise our atmosphere absorb energy in certain wavelengths while allowing energy with differing wavelengths to pass through.
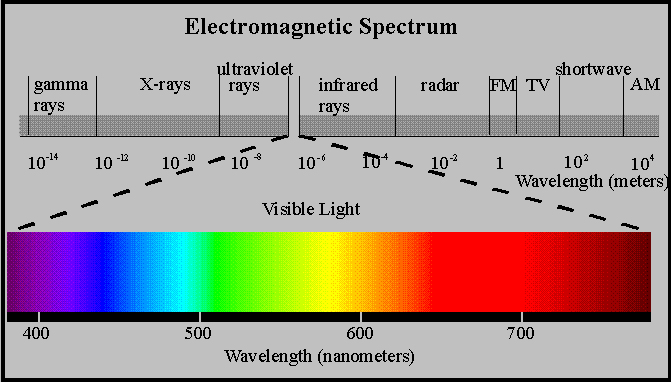
FIGURE 2: Electromagnetic (EM) Spectrum.
The areas of the EM spectrum that are absorbed by atmospheric gases such as water vapor, carbon dioxide, and ozone are known as absorption bands. In Figure 3, absorption bands (shown in brown) are represented by a low transmission value that is associated with a specific range of wavelengths. Trying to obtain remotely sensed imagery in the absorption bands is nearly impossible; thus, sensors are generally designed not to record information in these portions of the spectrum.
In contrast to the absorption bands, there are areas of the EM spectrum (shown in green in Figure 3 and described in Table 1) where the atmosphere is transparent (little or no absorption of energy) to specific wavelengths. These wavelength bands are known as atmospheric "windows" since they allow the energy to easily pass through the atmosphere to Earth's surface. It is in these windows that sensors are used to gather information about Earth phenomena.
Most remote sensing instruments on aircraft or space-based platforms operate in one or more of these windows by making their measurements with detectors tuned to specific frequencies (wavelengths) that pass through the atmosphere. When a remote sensing instrument has a line-of-sight with an object that is reflecting sunlight or emitting heat, the instrument collects and records the radiant energy. While most remote sensing systems are designed to collect reflected energy, some sensors, especially those on meteorological satellites, directly measure absorption phenomena, such as those associated with carbon dioxide (CO2) and other gases. The atmosphere is nearly opaque to EM energy in part of the mid-IR and all of the far-IR regions. In the microwave region, by contrast, most of this radiation moves through unimpeded, so radar waves reach the surface (although weather radars are able to detect clouds and precipitation because they are tuned to observe backscattered radiation from liquid and ice particles).
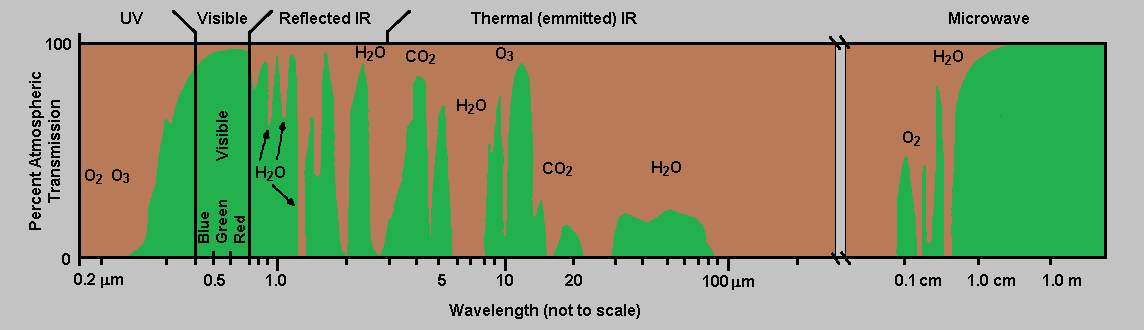
FIGURE 3: Atmospheric Windows.
Table 1: Major regions of the electromagnetic spectrum.
| Region Name | Wavelength | Comments |
| Gamma Ray | <0.03 nanometers | Entirely absorbed by the Earth's atmosphere and not available for remote sensing. |
| X-ray | 0.03 to 30 nanometers | Entirely absorbed by the Earth's atmosphere and not available for remote sensing. |
| Ultraviolet | 0.03 to 0.4 micrometers | Wavelengths from 0.03 to 0.3 micrometers absorbed by ozone in the Earth's atmosphere. |
| Photographic Ultraviolet | 0.3 to 0.4 micrometers | Available for remote sensing the Earth. Can be imaged with cameras and sensors. |
| Visible | 0.4 to 0.7 micrometers | Available for remote sensing the Earth. Can be imaged with cameras and sensors. |
| Near and Mid Infrared | 0.7 to 3.0 micrometers | Available for remote sensing the Earth. Can be imaged with cameras and sensors. |
| Thermal Infrared | <0.7 to 3.0 micrometers | Available for remote sensing the Earth. This wavelength cannot be captured by film cameras. Sensors are used to image this wavelength band |
| Micowave or Radar | 0.1 to 100 centimeters | Longer wavelengths of this band can pass through clouds, fog, and rain. Images using this band can be made with sensors that actively emit microwaves. |
| Radio | >100 centimeters | Not normally used for remote sensing the Earth. |
Traditional aerial photographs were black and white pictures based on camera and film technology. Such photographs related to one region of the EM spectrum. Satellite images are generally captured using sensors and digital technology. A sensor often records simultaneously in several different regions of the spectrum creating multi-images taken at the same time. The regions of the spectrum scanned are called “bands.” A band is identified in nanometers (nm). For example, an image or band scanned in the visible light region of the spectrum would be identified as 400-700 nm. With multi-bands various color composite images can be created. Also, bands of various widths on the spectral scale can be recorded.
A single band image shows features in various grey tones but if several images are combined, they can form a color composite. Figure 4 B is a true color composite image of Charleston, South Carolina. A true color composite is based on using the red, green, and blue portions of the visible region of the EM spectrum. This type of composite relates to what the human eye would see if a person was on a satellite or aircraft looking down at the Earth. Other band combinations form false color composites. Figures 4 A, C, and D represent two different false color composites. A false color composite generally enhances certain features on an image, features that might not be as apparent on a true color composite. Using different color composites is one way that a remote sensing specialist detects features on the Earth.
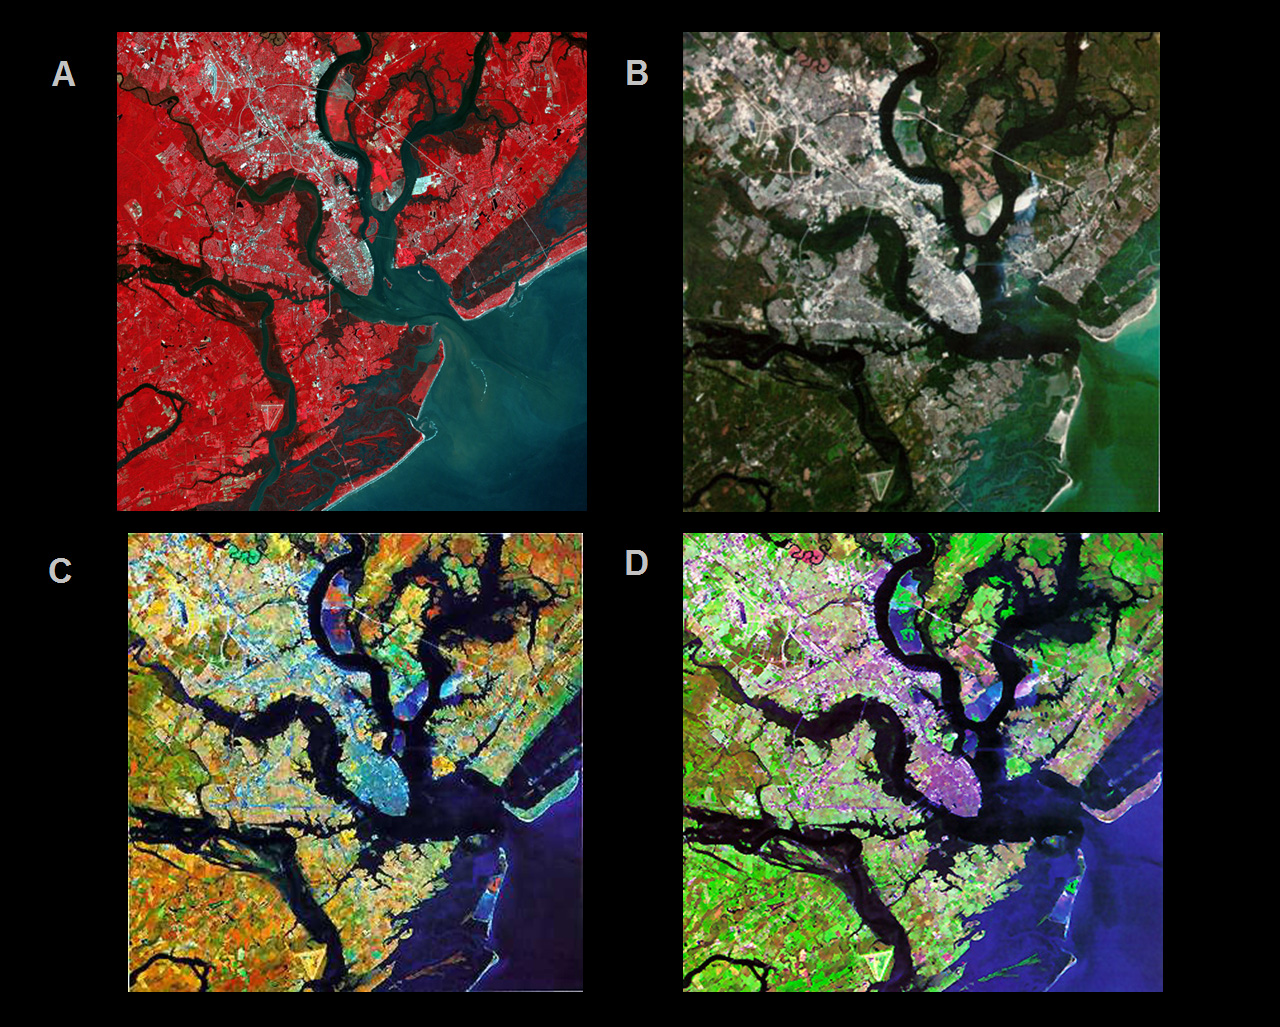
FIGURE 4: Color Composites.
RADIOMETRIC AND GEOMETRIC RESOLUTIONS
Digital remote sensing deals with two types of resolutions: radiometric (spectral) and geometric (spatial). Radiometric resolution is the number of levels that a sensor can record spectral information. Such information generally ranges from 0-255 to 0-65,535. The most common range is 0-255, which relates to the storage capacity of an 8-bit computer byte. These numbers are integer values (whole numbers). A single byte can hold one distinct integer value ranging from 0-255. This value represents the degree of reflective or emitted energy recorded by a sensor for a particular ground spot on the Earth’s surface.Although geographers take into consideration radiometric resolution when selecting imagery to study an environmental issue, they relate more toward geometric resolution due to its spatial nature.
FIGURE 5: One Kilometer Pixel.
Geometric resolution refers to the smallest amount of area on the Earth’s surface for which a sensor can record radiometric (spectral) information. Generally this resolution is expressed in terms of a pixel (picture element). The pixel size of the Enhanced Thematic Mapper sensor on Landsat 7 is 30m, which relates to an area of 30m x 30m on the Earth’s surface. In comparison, a sensor entitled AVHRR has a pixel of 1.1km2 while the panchromatic sensor on the QuickBird satellite possesses a 61cm2 pixel size.
Geometric resolutions vary greatly and are defined loosely as being low, moderate, and high. The parameters associated with these designations change as finer resolutions in imagery become available. Imagery identified as being of moderate resolution at one point in time might now be low resolution. Figure 5 shows the size of a one kilometer pixel as it compares to an American football field. An image with a one kilometer pixel size is viewed as being a low resolution image. Such an image provides a synoptic coverage of the Earth’s surface. An example of a low resolution image is Figure 6, which shows a massive dust storm blowing off the northwest African desert and blanketing hundreds of thousands of square miles of the eastern Atlantic Ocean with a dense dust.
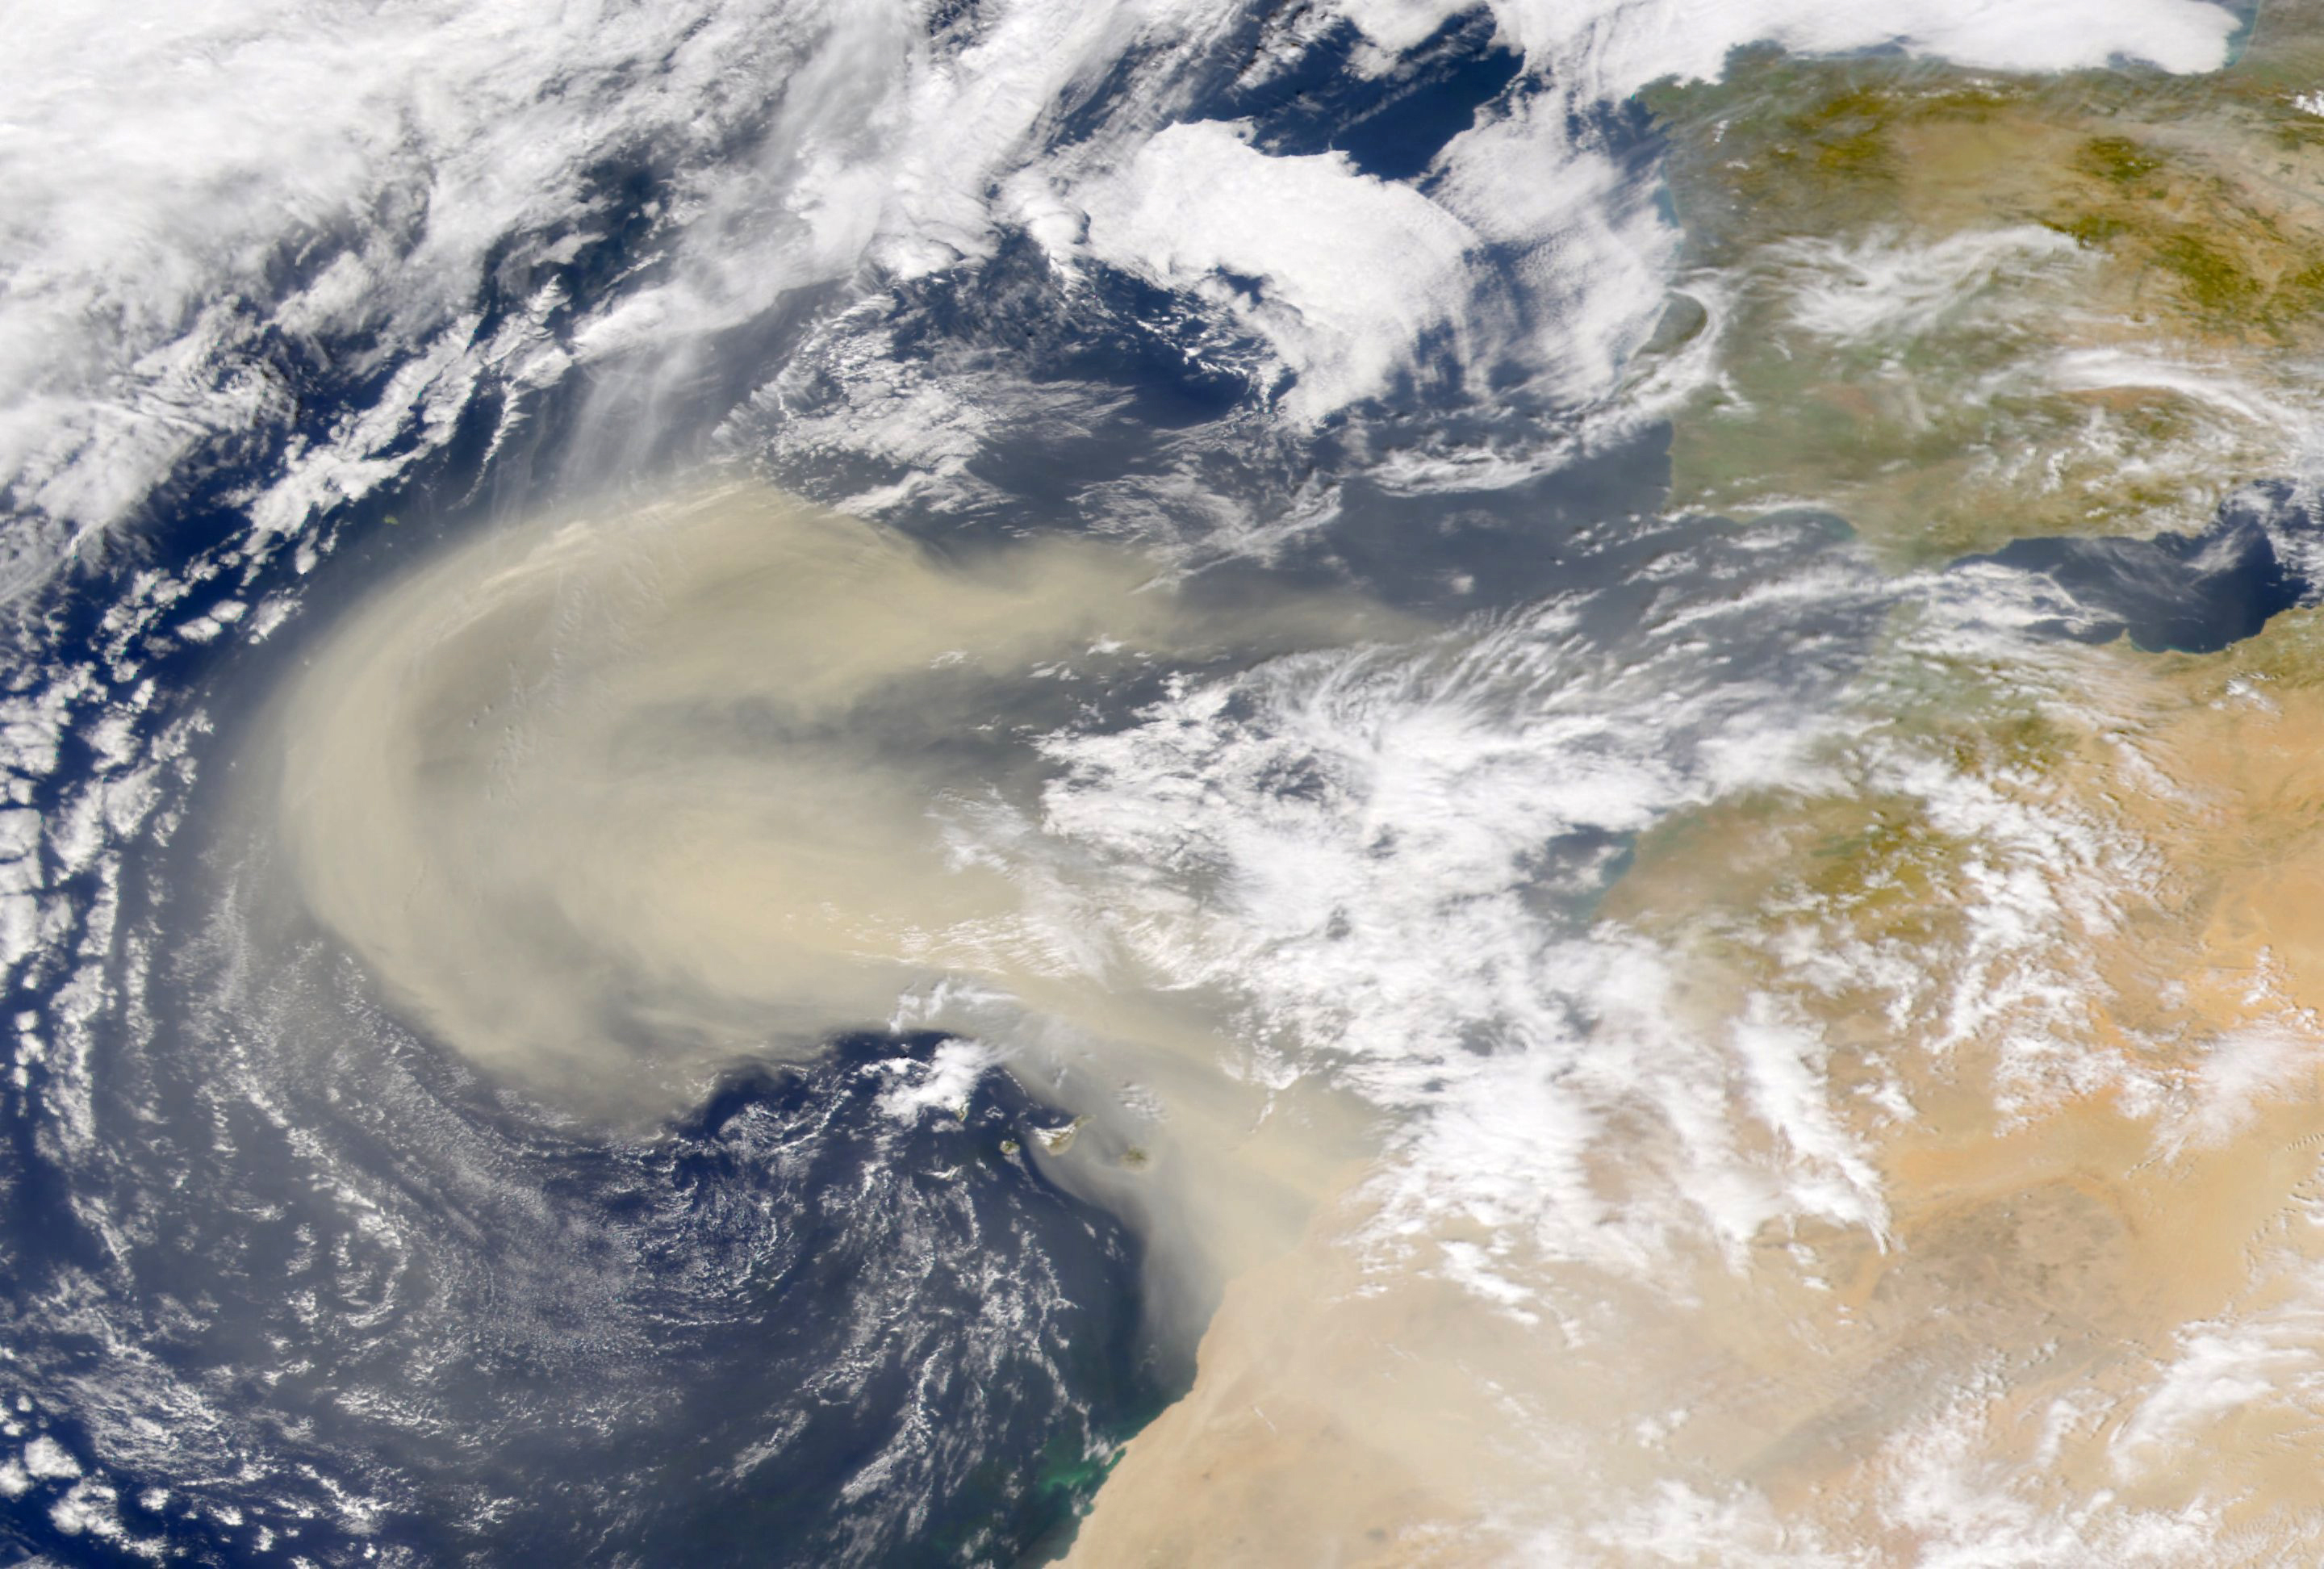
FIGURE 6: African Dust Storm (Low Resolution).
Figure 7 is a representation of an American football field that has superimposed on it several different pixel sizes. The Landsat 7 ETM+ sensor records images at a 30m resolution, which is a moderate resolution size. It would take 5.5 Landsat 7 pixels to cover the area of a football field. One would not be able to differentiate much about the field with only 5.5 pixels. The four images shown in Figure 4 are Landsat images. They provide more detailed information than the low resolution image of the desert dust storm in Figure 6 but do not cover as much area. Situated in the upper left portion of the field is a QuickBird pixel. An image with a 60cm resolution would be a high resolution image. It would take 8,361 such pixels to cover a football field. With this number of pixels one would be able to see a great amount of detail about the field. Figure 8 is a high resolution image of an actual football field. This image was acquired by a digital aerial camera and the pixel resolution is 30cm.
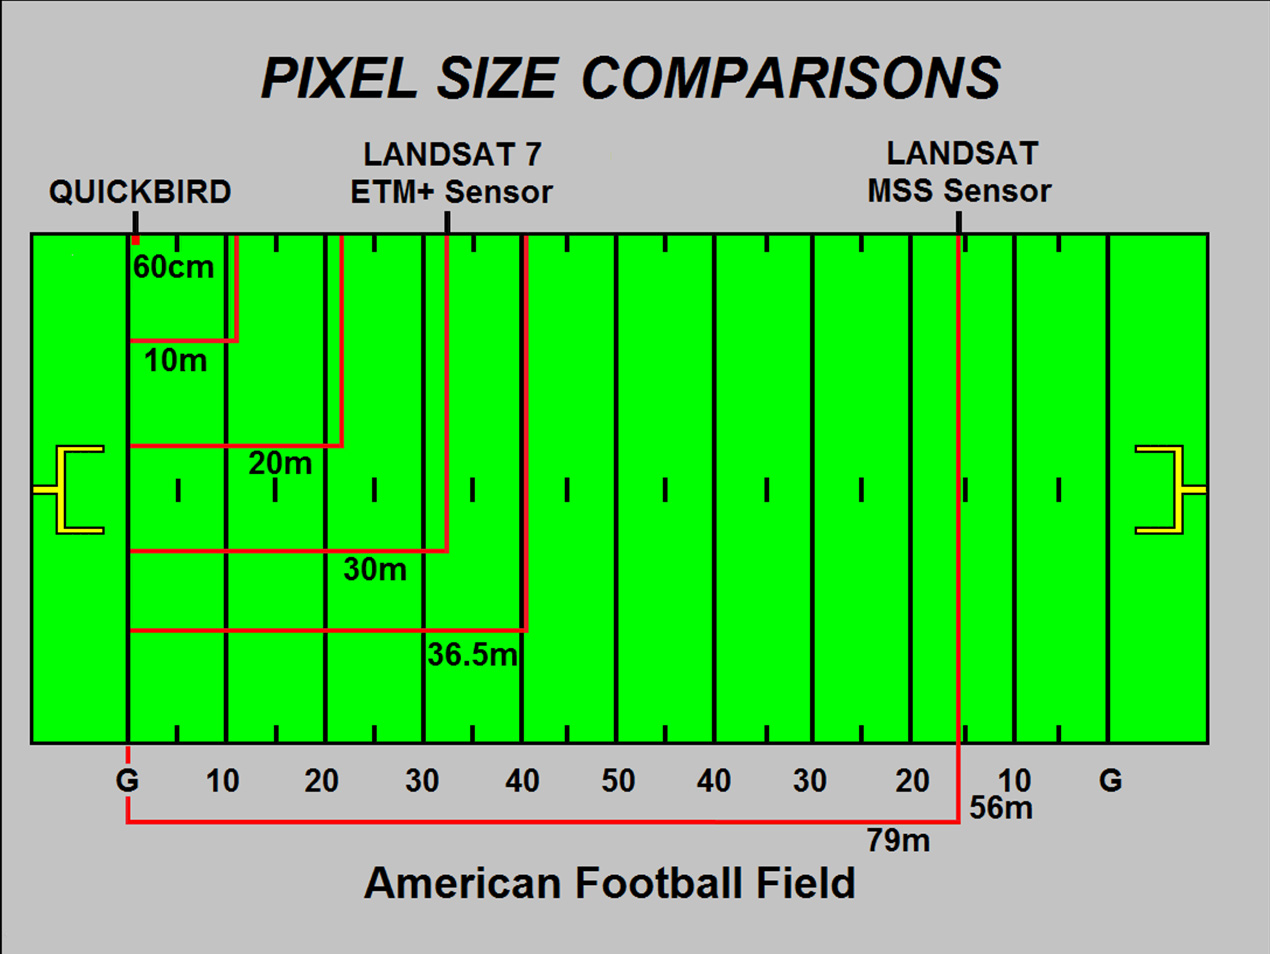
FIGURE 7: Pixel Size Comparison.
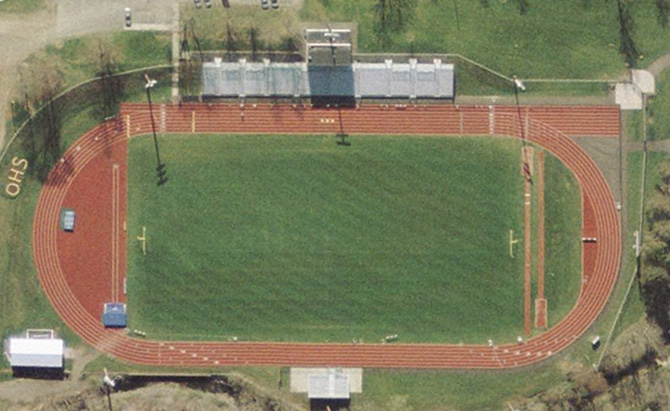
FIGURE 8: American Football Field (High Resolution).
Remote sensing imagery has many applications in cartography, land use and cover, agriculture, soils mapping, forestry, city planning, grassland management, archaeology, military observations, meteorology, and geomorphology, among other uses. In order to use such imagery, one must have considerable knowledge about the Earth’s surface and a strong background in remote sensing data acquisition and analysis techniques. Since the Earth’s surface consists of a mosaic of environmental conditions, geographers through their unique training in both the sciences and social sciences are well qualified to undertake various remote sensing applications.
SUPPLEMENT READINGS
Jenson, John R. 2007. Remote Sensing of the Environment: An Earth Resource Perspective. Person Prentice Hall.
Lillesand, Thomas M. and Ralph W. Kiefer. 1994. Remote Sensing and Image Interpretation. John Wiley and Sons, Inc.
Sabins Jr., Floyd F, 1978. Remote Sensing: Principles and Interpretation. W. H, Freeman and Company.