METR 361 Spring
2014
Nor’easter Lab
If you’ve been following
the model forecasts (and you should be), you must have noticed that early in
this week, even before our snow day on Wednesday, the GFS was predicting a
large and very intense coastal storm in New England for Sunday, Feb 9 and
Monday Feb 10. Some forecasters on TV
and on the Web were warning the public even though the forecast was for a time
period that was 168 hours away:
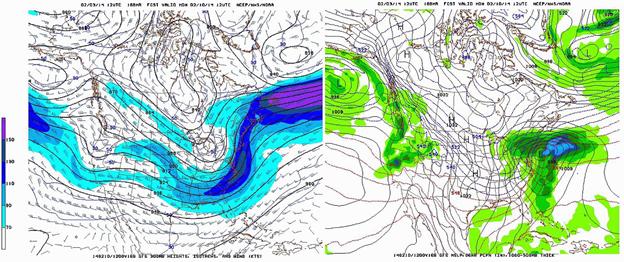
However, GFS runs on
Wednesday and later show this storm would affect New England only
minimally. What happened? That’s your job today. Using the IDV and current (Friday) maps you
get from the Web, discover how the GFS forecast was different from what
actually will occur this weekend.
Procedure:
1. Go into the computer
lab. Pick your favorite computer. Get the IDV running and load the file GFS Feb
3 2014 storm.zidv which you will find in the
Nor’easter lab folder inside the METR 360 folder. MSL isobars and precipitation maps are
already created and will be shown.
2. Using the web browser
(the spherical icon at the top of the screen), display the current and
near-future state of the atmosphere as shown by the current GFS model run,
hopefully initialized at 12Z Friday.
3. Compare today’s GFS run with the one from
Monday, that you loaded to the IDV. Save
images from the web and the IDV.
Side-by-side comparisons of the forecasts for the same date/time may be
particularly revealing. You know how to
save web images. On the IDV, you do it
this way: In the MapView
window, there is a View menu just above the left side of the display map
itself. Pulling that down, there is a
submenu called “Capture”. When you let
the cursor linger on the word Capture, another sub-menu pops up next to
it. Images can be saved by clicking on
Image or by keying in Ctrl-I. Movies are
also possible, although not quite what you think. Saving movies means capturing successive
images. You then need to put them
together as animated gifs, using another program. We have one.
Ask if you want to use it. Please
don’t click on Print.
4. As you did last week, write up what you found
in a report. What are the differences,
i.e., what is the atmosphere doing now, Saturday, and Sunday as forecast by the
short-term GFS, that is different from what was forecast by Monday’s GFS? Explain what you discovered in as much detail
as you need to account for the lack of a big coastal storm in New England.
Refer to your images and include the ones you need in your report.
Your write-ups are due next week, on Friday
before you leave the lab. Email them to
me at Jerome.Blechman@oneonta.edu