METR
361
Spring, 2008
![]()
State Abbreviations for Forecasting
METR 360 home page from last Fall
SUNY-SB MM5 page (helpful for forecasting)
Click here to download a shareware version of Automize (Large file: 25M!)
Sample
Exams
Blank U.S. base map for question 2
Spring
2007 Final Exam
Lecture
supplements
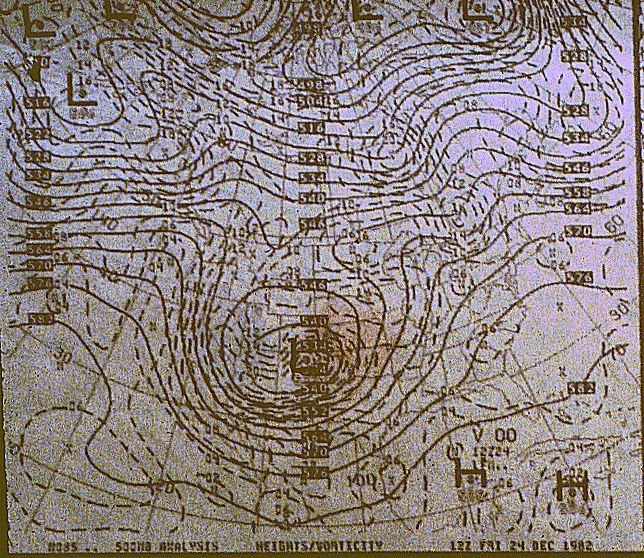
Lee-Side
Cyclogenesis Examples
|
Colorado
Blizzard Dec 24, 1982 |
|
Christmas
Day snowstorm of 2002
Severe Thunderstorms
SuperOutbreak
Maps (mostly from Hoxit and Chappell, 1975)
Synoptic 20Z
Surface map (from Agee,
et. al.)
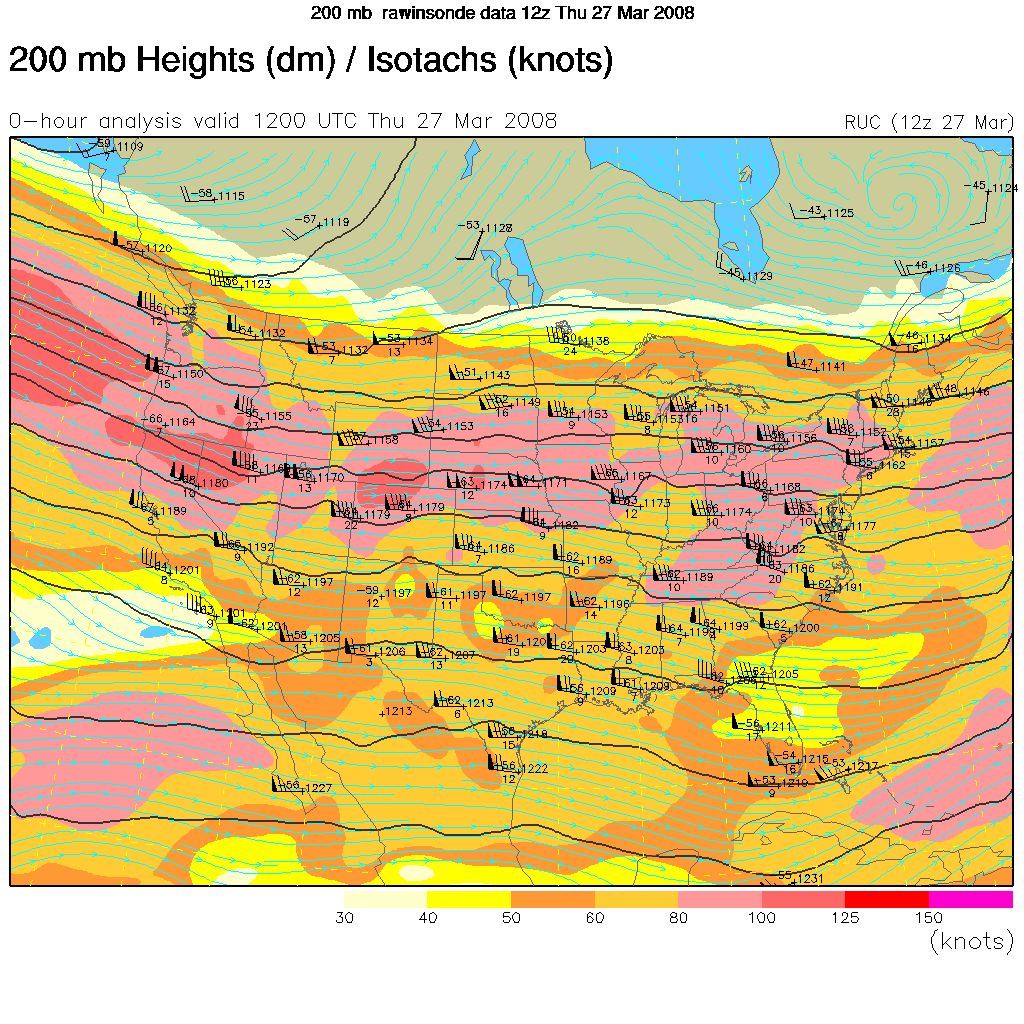
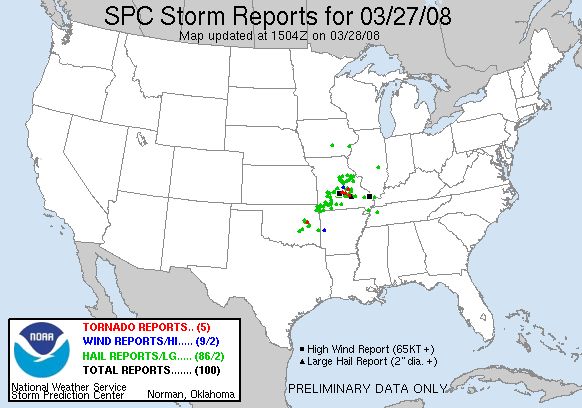
Composite Chart (example - March 27, 2008)
Summer
Synoptics
The flood of 2006
(PowerPoint)
Automated
Surface Observing System (ASOS)
PowerPoint Lectures
Modeling