METEOROLOGY 360
Fall, 2014
Exam 2
Directions:
Answer all parts of all questions in the blue books or write a
text file.
For calculations, show all work. You may
use any source, including your notes, any textbook or the Internet. You may NOT talk during the exam, except to
me. Raise your hand if you have a
question.
1. For this question, refer to the loop of NAM 300 mb initializations. This is a Powerpoint presentation that allows you to step through the loop frame by frame. These are not forecasts and you may treat them as verifications.
a. ( 6%) There is a wave over the Midwestern U.S. which has a trough marked T at the initial time (00Z, Jan 21, 2014). Using the Rossby Wave Equation, give two reasons why this wave is progressive.
b. ( 3%) The 500mb vorticity map from Unisys also shows the trough, although it’s not marked. What is the maximum of the absolute vorticity associated with this trough?
c. ( 6%) The 500mb vorticity map also shows you the location of the ridge that completes what we might call the “T wave” from part a. Where is that ridge and why is it not obvious from the height contours?
d. ( 4%) If the T wave is 1200 miles long and the circumference of the Earth at the latitude of this wave is 17590 miles, what is the wave number of the T wave? This may involve a decimal in the wave number.
e. ( 8%) The wave that consists of the high amplitude ridge in the Pacific Ocean and the trough in the eastern U.S. is stationary for the first week. If this wave is centered at 55ºN, what is the u-component of the wind? Estimate any information you need from the maps. You might want to use Daft-Logic. Its address is http://www.daftlogic.com/projects-google-maps-distance-calculator.htm. Show your work in a logical order. Please write neatly.
f. ( 6%) From the 300 mb loop, on Jan 28, an incoming jet stream cuts off the ridge and trough in Canada. By Jan 30, the resulting flow is from west to east across most of the United States but north and south across much of Canada. What terms do meteorologists use to describe the types of flow you see in the U.S. and in Canada on Jan 30? You must give two short answers.
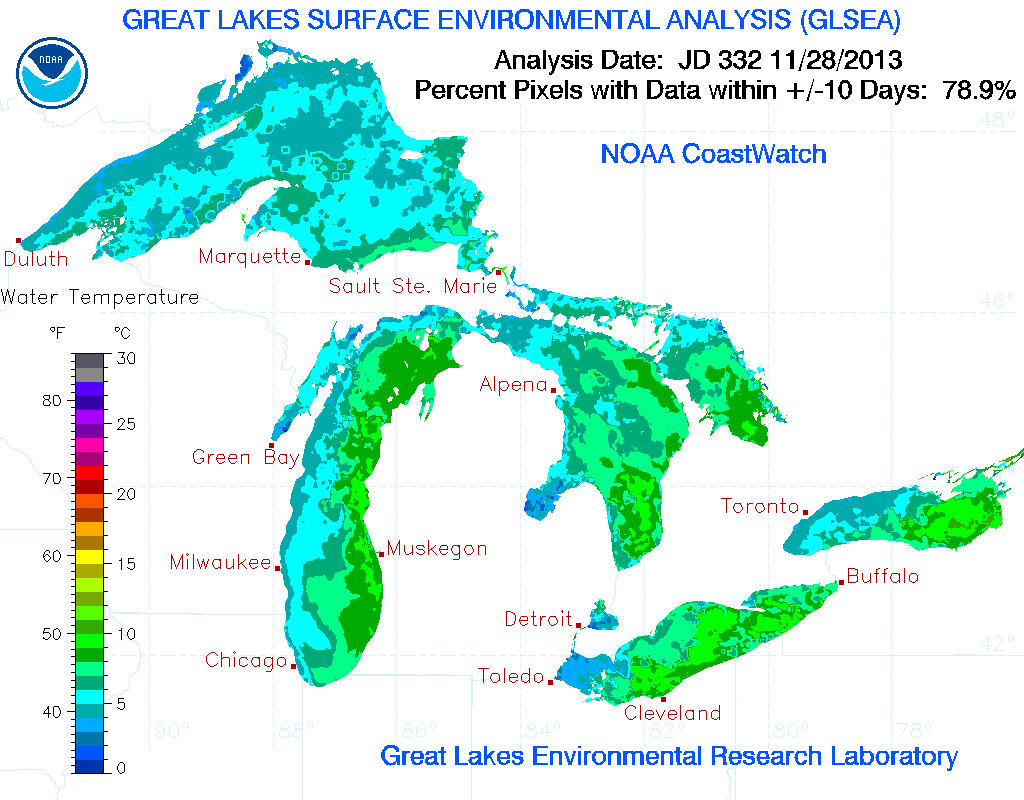
2. The maps for the period of Nov 27-30, 2013 are shown in three links: MSLP/Thickness, 850 mb heights/temperature, and 500 mb heights/vorticity. Three cities are marked on the MSLP initialization frame, Sault St. Marie (ANJ), Buffalo (BUF), and New York City (NYC). There is also a map of lake surface water temperatures.
( 18%) Will Lake-Effect precipitation occur at ANJ, BUF, or NYC during the period of these loops (00Z Nov 27 through 00Z Nov 30)? You must answer yes or no for each city. To support each of your three answers, make three cases, based on the information in the loops.
3. On Sunday, November 02, 2014, a deep upper-air trough caused cold temperatures to be felt as far south as Jackson, Mississippi (KJAN). The 12Z sounding showed a deep and intense inversion layer at KJAN with a surface temperature of 32.0ºF.
a. ( 4%) Using the text list of the sounding data, what is the 1000-500 hPa thickness in meters? Find this in the most direct way possible (hint: Look up the definition of thickness in the Glossary of Meteorology, http://glossary.ametsoc.org/wiki/Thickness)
b. ( 7%) Calculate the sea level pressure at KJAN from the station surface pressure of 1019.0 hPa and the station elevation above sea level of 92 meters. Estimate what else you need from the sounding list and note what information you used for those estimates. Show all work for the calculation.
4. On November 2, 2014, a coastal storm produced heavy snow in Maine. The MSLP map loop can be seen at this link.
a. ( 18%) From any combination of the NAM and GFS guidance files from 12Z on November 1, 2014, find three forecast parameters that would have told you that a coastal snow storm would strike eastern Maine in the 72 hours after initalization. Your three parameters must be forecasts of different weather elements such as temperature, dew point, wind, etc. For example, do not choose both the NAM and GFS temperature forecasts. At least one of your forecast parameters must reveal how you know this will be a coastal storm, not an inland storm. For each forecast parameter you find, briefly explain what it tells you that allows you to answer this question.
b. ( 5%) From the Caribou observations, it is apparent that the guidance was not entirely accurate, particularly the GFS. By how much did the GFS Direct Output underestimate the precipitation amount from 12Z Nov 2 to 12Z Nov 3 (actually 1154Z to 1154Z)? How would that error have impacted the general population of Caribou?
c. ( 8%) How is the 48 hour surface prog for 12Z Sunday Nov 2 different from the 12Z MSLP map (from the loop)? Restrict your answer to the coastal storm. You may only use information from those two maps.
d. ( 7%) Use the features you found on the surface prog for part c to explain the precipitation discrepancy between the numerical guidance products and the surface observations (part b).