METEOROLOGY 360
Fall, 2014
Final Exam
Directions:
Answer all parts of all 7 questions.
Use the blue books or write a text file where required. Draw on
the
paper copy of the exam where requested. For calculations, show all work. You may use any source, including your notes,
any textbook or the Internet. You may
NOT talk during the exam, except to me.
Raise your hand if you have a question.
The following
information may (or may not) be
useful:
1. For
this question, refer to the 00Z 500 mb map
that goes with the map for MSLP,
a. ( 10%) The short wave in the Pacific Northwest of the U.S. has a mean latitude of 50ºN. It’s wavelength is 4000 km and the mean west-east wind is 30 m s-1. Given those attributes, in which state will the vorticity maximum be 24 hours after this map? Show your work and explain why you chose that state.
b. ( 4%) What is the value of the maximum of relative vorticity associated with the Pacific Northwest short wave at 00Z on the 500 mb map? Include units. The latitude of the vorticity maximum is 45.5ºN.
c. ( 6%) When the vorticity maximum shown on the 500 mb map reaches its destination 24 hours, it will have a different value. How will it change (increase, decrease, or remain the same) and why?
d. ( 5%) What will the trough of the short wave look like in 24 hours? Draw it on the following map. Your drawing must conform to your answers for parts a, b, and c of this question.
2. For this question, refer to the sounding from Midland, TX (KMAF) which is about 140 miles west-southwest of Abilene.
a. ( 6%) A front lies to the south of KMAF (not shown). Using the sounding, estimate the height of the top of the frontal zone above the ground, in meters. To do that you will need the mean temperature of that layer. Use 273K. Get other needed numbers from the sounding. Show your work.
b. ( 7%) Pilots will need to know important meteorological information about KMAF to take appropriate safety measures when taking off or landing. What information will they need from this sounding? You must think about what the information on the sounding means for flying. Don’t simply say that pilots will need to know the temperature, dew point, and wind which is what all soundings show.
3. On the MSLP map for the southeastern U.S. at 12 UTC, there is a cold front.
a. ( 6%) Where the red X is shown, this front is not located in the correct place. Give two reasons that support that statement, based on the data shown on the map.
b. ( 6%) On the map below, draw the entire front to better fit the data shown. If you need to change the type of front in whole or part, make the correction where you think it is appropriate.
4. (15%) This question is about the NAM guidance shown at this link. KXYZ is a real place, although obviously that is not its real ICAO designation. Assume the guidance is perfectly correct. Based on that guidance, complete the following table, including units:
|
Time/Date |
00Z
Nov 27 |
12Z
Nov 27 |
00Z
Nov 28 |
|
Surface
Temperature |
|||
|
12-hour
precipitation amount |
|||
|
Precipitation
type |
|||
|
850
mb temperature |
|||
|
Wind
Direction (º) |
5. Click on the link for a hodograph, drawn on X and Y axes. The numbers around the graphed line are heights in meters.
( 6%) What is the wind at 12964 meters? Give the speed in knots and the direction in degrees.
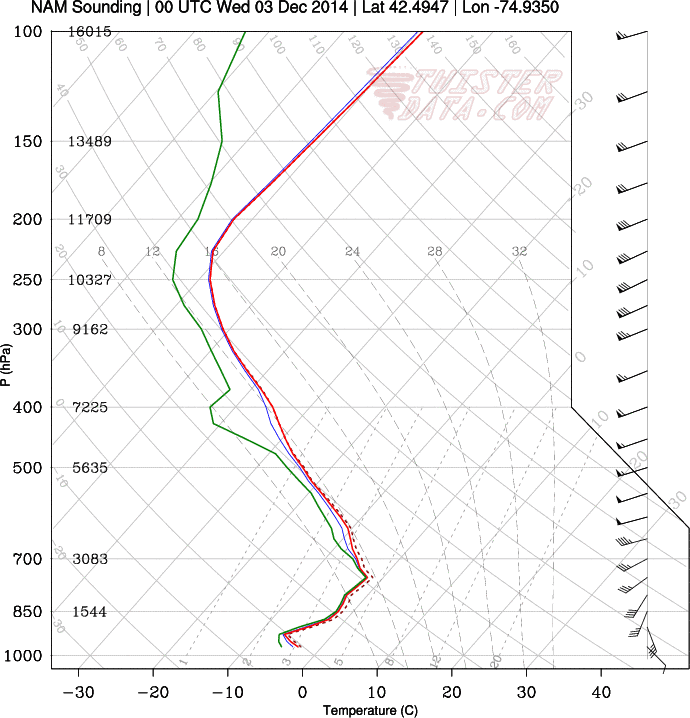
6. The NAM 36 hour forecasts for 00Z Dec 3, 2014 are shown for the following products: MSLP pressure/thickness/6-hr precip, MSLP pressure/2 m temperature/6-hr precip, 925 mb height/temperature/wind flags, 850 mb height/temperature/wind flags, 700 mb height/RH/Omega, 500 mb height/Abs. vorticity/wind flags and a sounding at Oneonta. Precipitation is shown in the mid-Atlantic and Ohio River Valley areas.
a. ( 3%) What do meteorologists call the situation forecast for the mid-Atlantic and Ohio River Valley areas? Just name it.
b. ( 9%) What map elements in this 36 hour forecast show you that this situation is the one you named in part a? Name three, also identifying which map each element comes from. You do not have to explain how your elements work.
c. ( 3%) What is causing the vertical motion that leads to precipitation in mid-Atlantic and Ohio River Valley areas on the MSLP forecasts? You must refer to one of the three vertical motion producers we discussed in class.
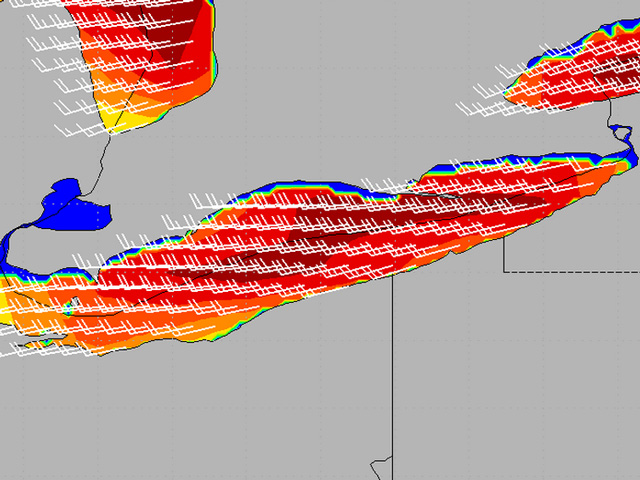
7. The spectacular Buffalo lake effect storm of November 17-18, 2014 was well forecasted by the meteorologists at NWS-Buffalo.
a. ( 9%) Looking at the NAM
MSLP forecasts for 24 hour, 48
hour, and 72 hours, forecast
surface winds, the 850 mb forecast loop,
and
the 500 mb loop, what elements would
have shown
the forecasters that some kind of lake effect event was about to occur? Find something at the surface, 850 mb, and
500 mb. You don’t have to explain
how
each element would have worked, just find and identify them.
b. ( 5%) What meteorological or other feature that would have indicated an historic snow event does NOT appear on the maps shown? For this one, you must explain why the feature would change an ordinary lake effect snow event into a spectacular one. You may need to do some research since you don’t have the maps to show your feature.