METR 360
Fall, 2017
Exam 1
Directions:
Answer all parts of all questions in the blue books or write a text file
which you may e-mail to Jerome.Blechman@oneonta.edu. For
calculations, show all work. You may use
any source, including your notes, any textbook or the Internet. You may NOT talk during the exam, except to
me. Raise your hand if you have a
question.
1. On January 16, 2015 the following
observations were made at Oneonta:
Sky condition: overcast, Temperature: 27°F, Dew point: 24°F, wind, 7 knots from 250°, Sea level pressure: 1015.2 mb, station
pressure: 966.5 mb, 3-hour pressure change -1.5 mb, light continuous snow at time of observation.
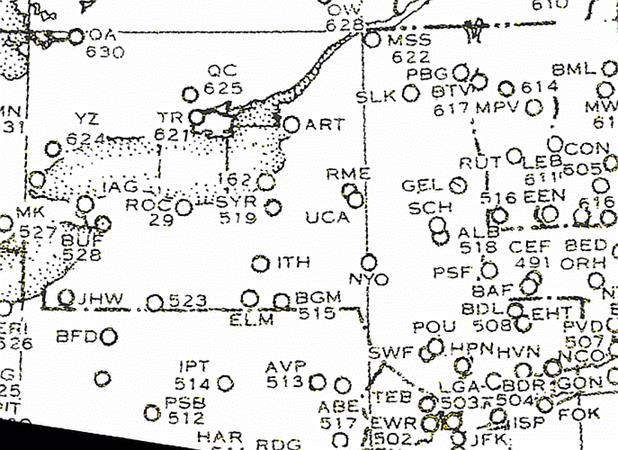
( 14%) Plot the proper surface
observations using synoptic code on the following New York State map at the
station circle in Oneonta’s (NYO) location (note north is toward the top of the page):
2. Here are the first six reports from your
radiosonde release of September 13:
PRES.
TIME HGT/MSL TEMP.
RH DEWP W.D
W.S
mb HH:MM:SS
Meter °C %
°C Deg. Knots
----------------------------------------------------------------
964.5
00:00:00 33 26.0
48 14.1 225
0
952.2
00:00:06 484 24.7
38 9.6 213
4
925
00:00:20 568 23.0
44 10.2 207
4
850
00:01:57 1141 17.7
65 11.0 221
8
837.7
00:02:22 1260 16.4
68 10.6 208
10
700
00:06:58 2788 10.1
81 6.9 250
13
(15%) Write the proper upper air code for each of the levels. Group them into TTAA code and TTBB code whichever is appropriate for the data shown. These will obviously be short as there are only six levels.
3. For this question, refer to the PowerPoint presentation link for Q3NAMfcst.ppt. If you are on a Linux PC, just double-click the PowerPoint and it will open in the Linux version. Mac users can also view this presentation.
a. ( 8%) We were all set to forecast for Rapid City, SD when the WxChallenge contest manager pulled the station out and switched to Providence. But Rapid City had interesting weather around that time so make a “forecast” based on the NAM and surface progs. Your forecast is for the period of the NAM forecast, namely 12Z on Sep 21 through 12Z on Sep 24. You are only to forecast weather conditions (fair, light continuous rain, thunderstorms, heavy snow, fog, etc.) and relative temperatures. Take them in 12 hour increments so you could forecast something like this (note these are not the answers, just the format):
Time period Forecast
12Z Sep 21 – 00Z Sep 22 Clear and cold
00Z Sep 22 – 12Z Sep 22 Warmer with rain showers
12Z Sep 22 – 00Z Sep 23 Much colder with heavy snow
00Z Sep 23 – 12Z Sep 24 Clearing, not as cold
Make a table like that but write in your forecasts for those five periods, based on the NAM forecasts in Q3NAMfcst.ppt and the surface prog presentation, Q3Progs.ppt. For your information and convenience, the location of Rapid City is marked with a black circle and the designation RAP just north of that circle in the first frame of Q3NAMfcst.ppt and in every frame of Q3Progs.ppt
b. ( 20%) Explain why you made each of your forecasts using the Norwegian Cyclone Model and what we know about fronts.
4. For this question we again consider Rapid City which is a radiosonde station with the designation UNR. You have the 12Z surface map for an unspecified day, with UNR marked (black station circle). You also have the 12Z radiosonde sounding. Click the links to see them.
a. ( 5%) Is there any layer where the sounding is absolutely stable? What are the top and bottom pressures of that layer? (layer example: 1000-920 mb which is not this answer) Note, there could be multiple absolutely stable layers on this sounding. You only have to find one.
b. ( 5%) Is there any layer where the sounding is conditionally unstable? Again, what are the top and bottom pressures of that layer? Again, you only have to find one layer.
c.
( 5%) Is there any layer where the sounding is absolutely unstable? Again, what
are the top and bottom pressures of that layer? Again, you only have to find one layer.
d. ( 8%) Notice the winds plotted on the axis on the right side of the sounding. The winds near the surface are all from the north or very similar directions, but at around 675 mb, they come from the SW. What kind of turning with height is this, veering or backing? How does the turning of wind tell you about the motion of air masses in that area? (Hint: look at the 12Z surface map).\
5. ( 20%) For this question, draw isobars on the paper surface map included with this exam. Here’s a link to that map that you can use to study the data more closely. Use the standard isobars and contour interval. Draw in pencil but go over your isobars in black felt-tip ink. Be sure to label your isobars in a standard way. If appropriate, include pressure center(s) (H and/or L) in the proper place(s).