METEOROLOGY 360
Fall,
2015
Exam 1
Directions:
Answer all parts of all questions in the blue books unless
otherwise
directed. For calculations, show all work.
You may use any source, including your notes, any textbook or
the
Internet. You may NOT talk during the
exam, except to me. Raise your hand if
you have a question.
The following
information may (or may not) be
useful:

1. The following map may also be found at this link:
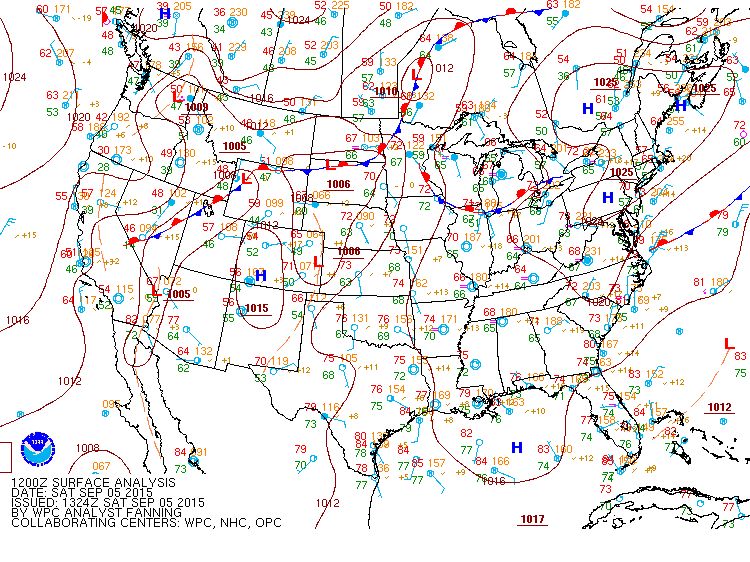
a. ( 3%) There are fronts in central Canada, the northern U.S., and off the east coast. What is the one frontal type of all the fronts on this map?
b. ( 5%) The front in the Midwest appears to be extending into the Highs that are over the Northeast U.S. Why can’t the front go all the way into the center of any of the Highs?
2. This question refers to the map below. The map may also be found at this link:
a. ( 12%) Based on our criteria for drawing fronts, this front is, for the most part, drawn correctly. Explain to a meteorologist how the observations shown on this map support that frontal position as shown. You must refer to each of the criteria specifically. Use examples from the map.
b. ( 4%) Despite your answer to part a, there is one place on this map where the front is probably not drawn in the correct location. On this page (paper), redraw that part of the front so that it fits all the data shown.
3. For this question, refer to the morning (12Z) sounding, from Nashville, TN (click to download):
a. ( 6%) What is the direction and speed of the max wind observed on the Nashville sounding? Include units. Also, note the level where you found that wind. Assume north is toward the top of the page.
b. ( 12%) In the blue book, draw a station plot showing the surface weather at KBNA from the data shown on the 12Z sounding. Use the standard station model. Plot everything you know from the sounding.
c. ( 7%) What happens at 900 mb on this sounding and what weather map feature does it represent?
d. ( 4%) Lift an air parcel from 975 mb (not the surface) to its LCL. Where is the LCL (mb)?
e. ( 5%) Lift the air parcel from part d until it gets to 650 mb. Is this parcel stable or unstable? Why?
f. ( 12%) What would be the TTAA code for the data shown at 850 mb? Show all groups for that level only.
4. For this question, use the 15Z map below, centered on Missouri:
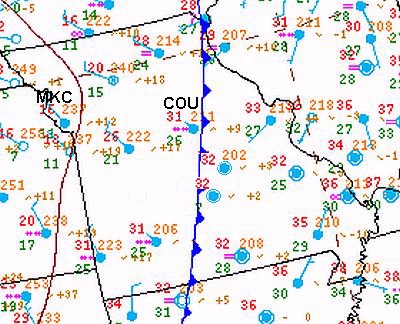
a. (12%) The city of Columbia, MO is marked COU. The wind barbs are obscured by the temperature. Columbia is at a latitude of 38.5°N. If the angle the cold front makes with the ground at COU is 2.0°, what is the (geostrophic) wind speed at Columbia? Use the data on the map. Assume the temperature difference right at the front is well represented by the stations closest to it in Missouri. You now have everything you need to make this calculation. Show your work. Be sure to specify the units on your answer.
b. ( 5%) Kansas City is marked MKC. If Kansas City is 122 miles west of Columbia and given the information shown on the map, what 18Z forecast of wind speed and direction, sky condition, precipitation, and temperature for MKC would be consistent with this map and what we know about fronts?
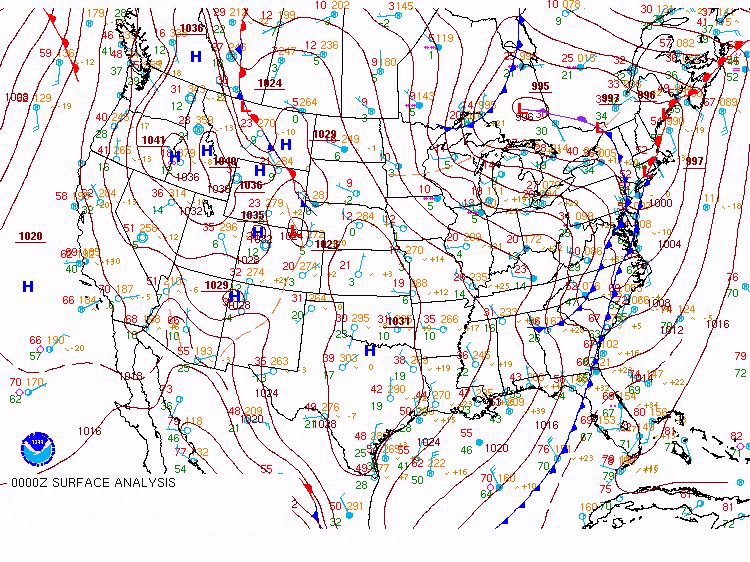
5. This question requires the following maps. Both are for the same date and time. Click the maps to get digital versions.
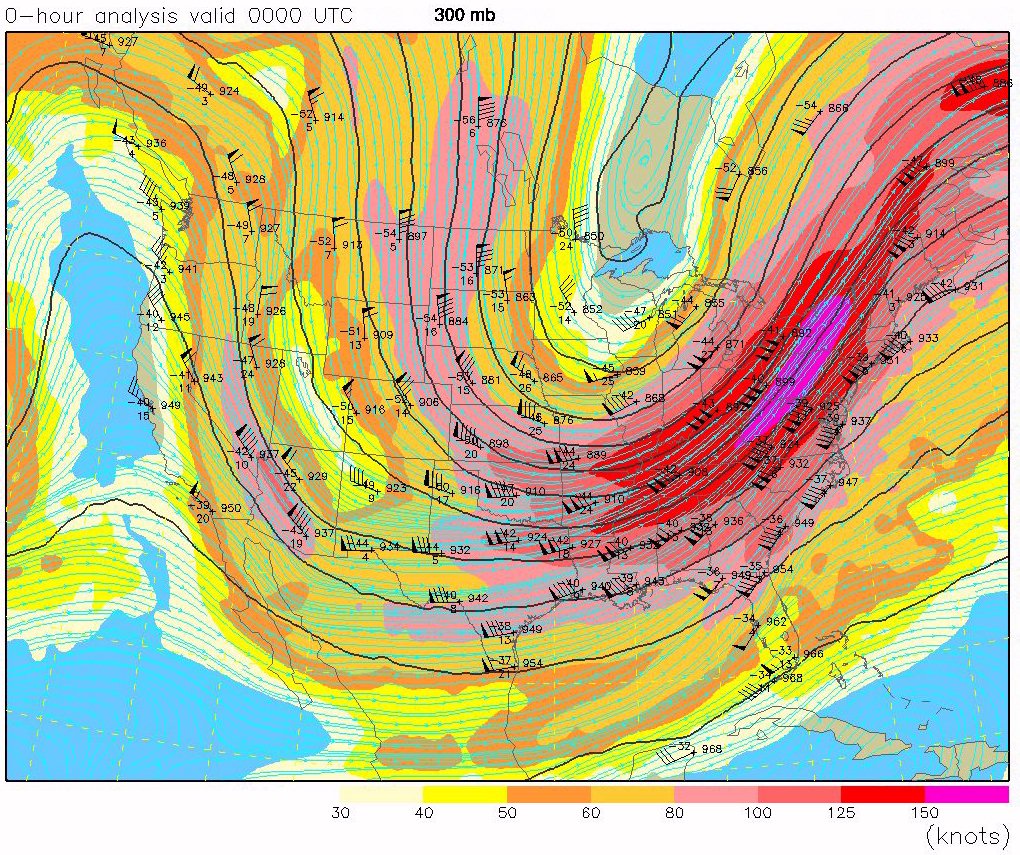
a. ( 8%) What two upper air features are shown in the height contour pattern of the upper air map and where is the axis of each one?
b. ( 5%) The approximate position of Oneonta is marked NYO on the paper copy of the surface map. The actual location is the black filled circle. In the blue books, draw a station model of Oneonta that would be consistent with the weather patterns shown on both the surface and upper air maps.