METR 360
Fall,
2015
Exam 2
Directions:
Answer all parts of all questions in the blue books or write a
text file.
For calculations, show all work. You may
use any source, including your notes, any textbook or the Internet. You may NOT talk during the exam, except to
me. Raise your hand if you have a
question.
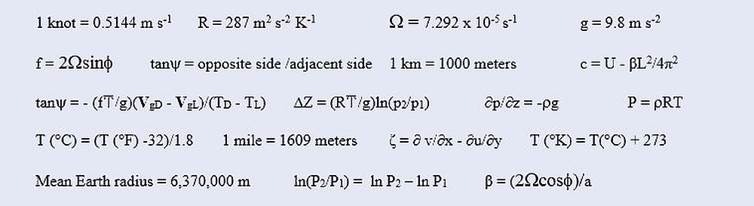
The following
information may (or may not) be
useful:
1. This question refers to the MOS products below:
GFS MOS (MAV)
KABC GFS MOS GUIDANCE
11/15/2015
0000 UTC
DT
/NOV 15
/NOV 16
/NOV 17
/
HR 06
09 12 15 18 21 00 03 06 09 12 15 18 21 00 03 06 09 12 18 00
X/N
57
36
38
28
43
TMP 37
36 36 37 49 54 51 47 48 46 42 37 36 34 33 34 34 33 31 37 41
DPT 27
24 22 22 22 22 24 24 24 28 29 27 28 26 24 23 21 20 20 20 25
CLD CL
CL CL CL CL FW SC OV OV OV OV OV OV OV OV OV OV BK BK OV OV
WDR 15
15 15 15 17 18 19 16 15 14 32 33 33 32 32 33 35 34 17 17 15
WSP 06
08 10 10 15 20 14 13 14 08 03 10 13 14 11 12 06 04 04 04 05
P06
0 0
2
5 26
53
29 16
1
2 8
P12
2
28
65
16
8
Q06
0 0
0
0 0
2
0 0
0 0 0
Q12
0
0
2
0
0
T06
0/ 5 0/ 1 0/
1
0/ 0 0/ 1 1/
0
0/ 0 1/ 0 0/
3
0/ 0
T12
0/ 5 0/
3 1/ 2 1/ 0
0/ 5
POZ
0 1 1
2 1 0
0 0 1
0 0 0
0 0 0
0 1 0
0 0 1
POS 37
46 48 46 21 42 47 44 49 56 65 76 89 81 83 77 79 75 76 90 75
TYP
R S S
S R R
S R S
S S S
S S S
S S S
S S S
SNW
1
0
CIG
8 8 8
8 8 8
8 7 7
6 4 4
5 6 5
6 8 8
8 7 6
VIS
7 7 7
7 7 7
7 7 7
7 7 5
7 7 7
7 7 7
7 7 7
OBV
N N N
N N N
N N N
N N BR N
N N N
N N N
N N
------------------------------------------------------------------------
NAM MOS (MET)
KABC NAM MOS GUIDANCE
11/15/2015
0000 UTC
DT
/NOV 15
/NOV 16
/NOV 17
/
HR 06
09 12 15 18 21 00 03 06 09 12 15 18 21 00 03 06 09 12 18 00
X/N
52
32
38
24
39
TMP 37
35 33 36 46 50 44 40 40 38 35 33 35 36 33 31 30 28 27 33 37
DPT 29
27 27 26 27 25 25 29 32 32 31 30 33 32 30 27 25 23 22 22 23
CLD CL
CL CL CL CL SC BK OV OV OV OV OV OV OV OV BK OV BK OV OV OV
WDR 15
15 15 15 16 17 19 16 14 15 32 34 33 28 33 34 33 34 13 11 32
WSP 10
06 07 13 17 18 18 08 06 07 08 05 13 13 13 11 07 05 04 07 05
P06
1 1
1
32 20
48
29 28
12 32
8
P12
2
43
62
30
32
Q06
0 0
0
0 0
1
0 0
0 1 0
Q12
0
1
1
0
0
T06
0/ 0 0/ 0 1/
2
2/ 4 6/ 0 2/
1
0/ 0 1/ 0 1/
2
1/ 3
T12
0/ 0 2/
4 7/ 1 1/ 0
2/ 2
SNW
0
1
CIG
8 8 8
8 8 8
8 7 6
7 6 5
3 6 2
6 4 7
7 4 7
VIS
7 7 7
7 7 7
7 7 7
7 6 7 7 7
7 7 7
7 7 7 7
OBV
N N N
N N N
N N N N
BR N
N N N
N N N
N N N
a. ( 12%) What does the NAM MOS predict for 00Z on November 17? To answer, draw a station model using the predicted observations at that time at KABC.
b. ( 12%) What weather map event do these MOS products predict to happen sometime during the day on November 16? Give three reasons from the guidance products that support your answer.
c. ( 10%) There is a significant difference between NAM MOS and GFS MOS for the event that happened on November 16. What is that difference and which guidance product did a more consistent job of predicting it? Explain why you chose your answer. Note: there are lots of differences. Find one that is significant, i.e., more than minor variations in the numbers.
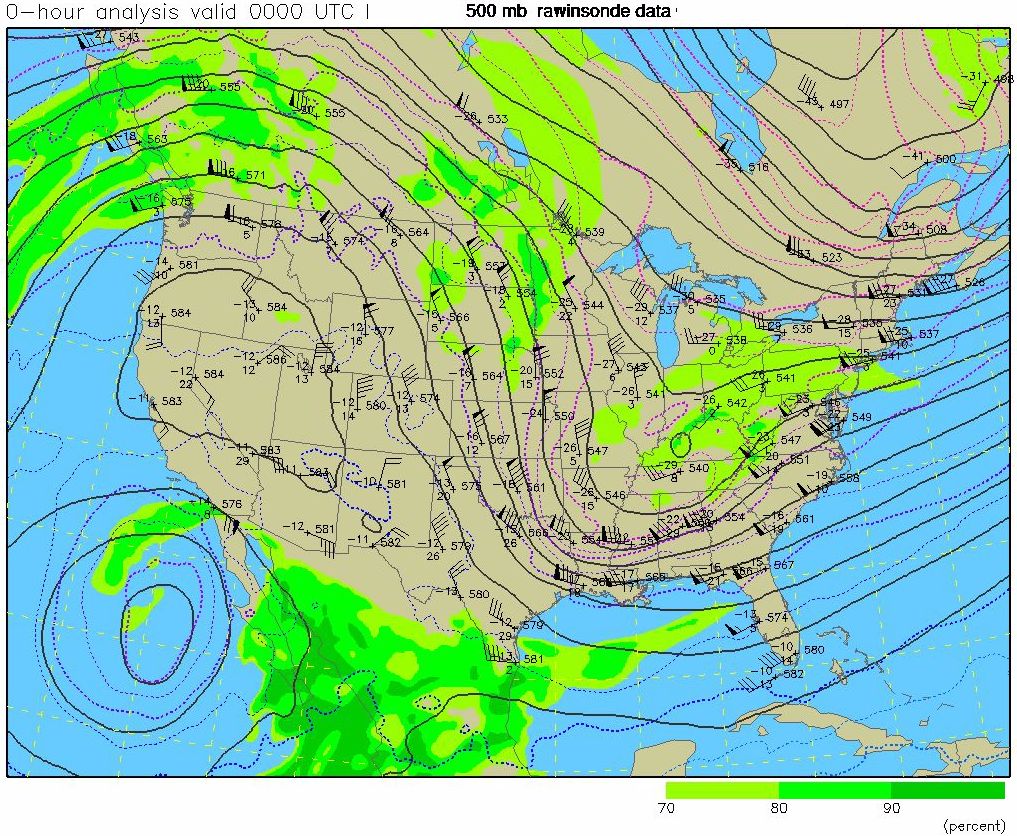
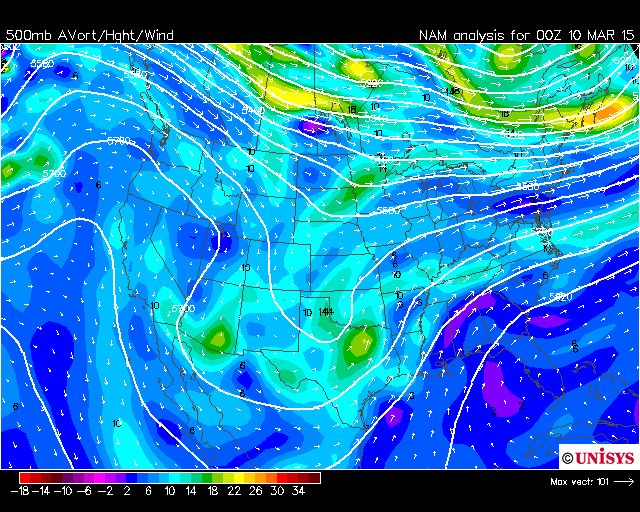
2. For
this question, use the 500 mb maps for 00Z.
You have one showing the entire
U.S.
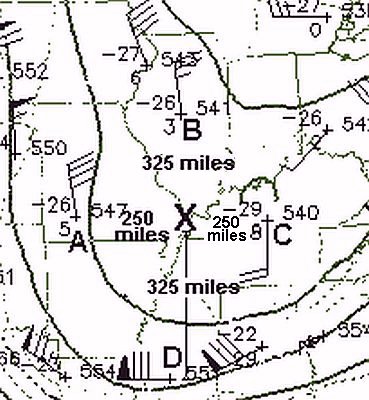
and one which is just the middle
Mississippi River
valley. These are from the same time
and date.
a. ( 6%) If the length of the long wave shown is 3000 miles (4827 km), centered on 45°N (circumference of 28300 km), what is the wave number of that wave?
b. (10%) What wave speed does the Rossby wave equation predict for the long wave of part a? Estimate what you need from the map. Is this wave progressive, retrograde, or something else?
c. ( 5%) There’s a closed circulation in the Pacific Ocean, south of California as shown by the ESE 70 kt wind at San Diego. Is this circulation very baroclinic or very barotropic? Briefly explain your choice.
d. ( 10%) The middle Mississippi River valley has been enlarged and modified. Using stations A, B, C, and D, estimate the absolute vorticity at location X (Cairo, IL, latitude 37°N) as accurately as you can. The distances shown are from X to A, B, C, and D. Show your work. Show units.
e. ( 4%) Would the relative vorticity at Cairo be considered cyclonic or anticyclonic? Pick one.
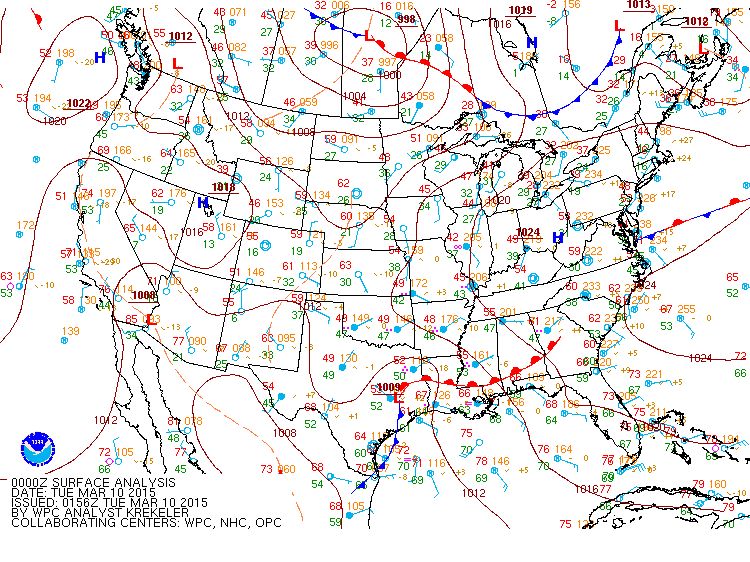
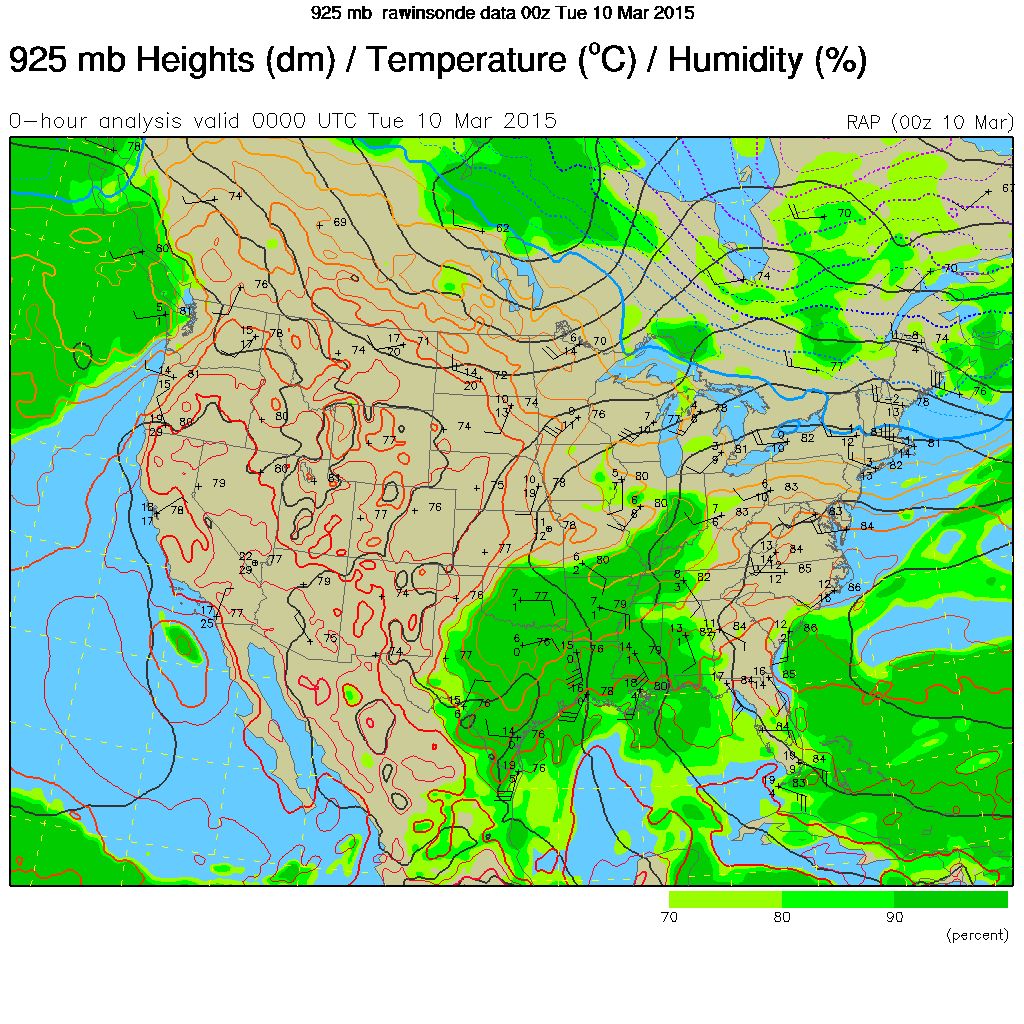
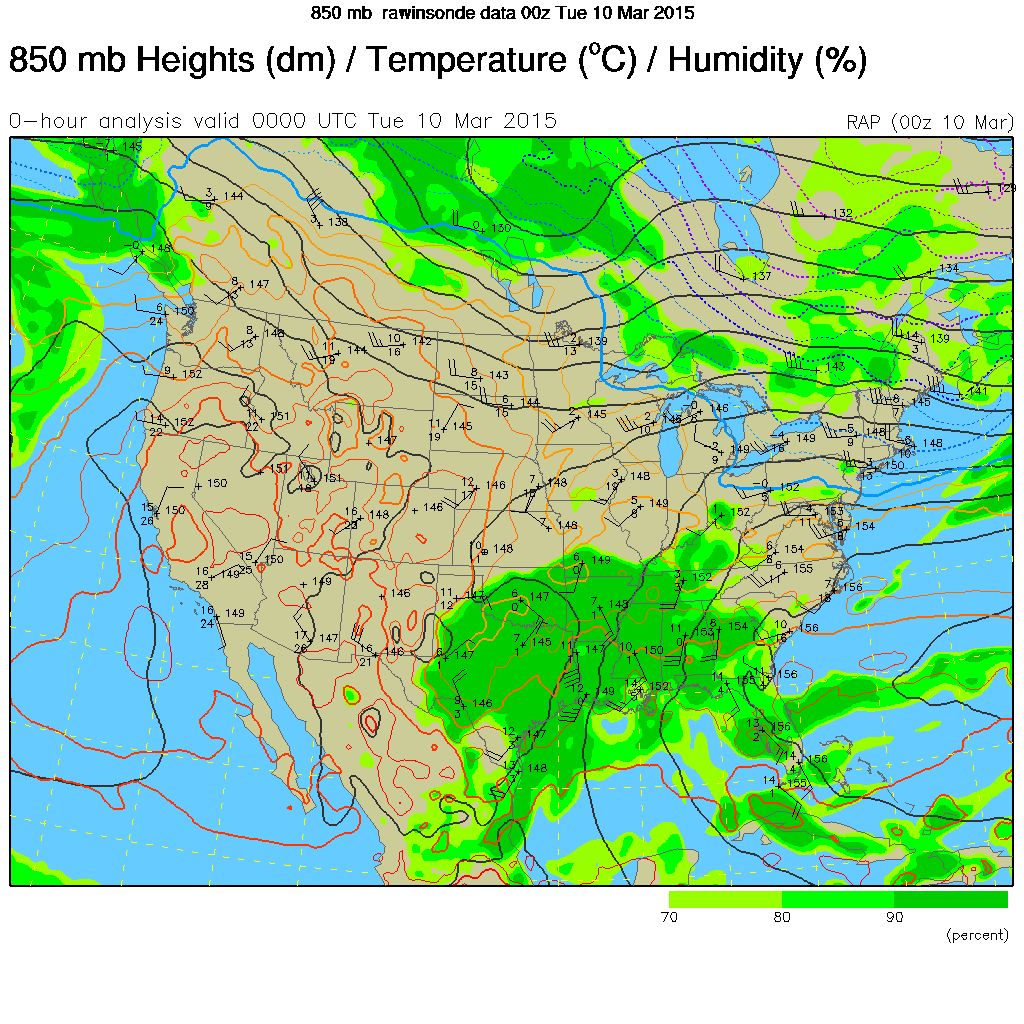
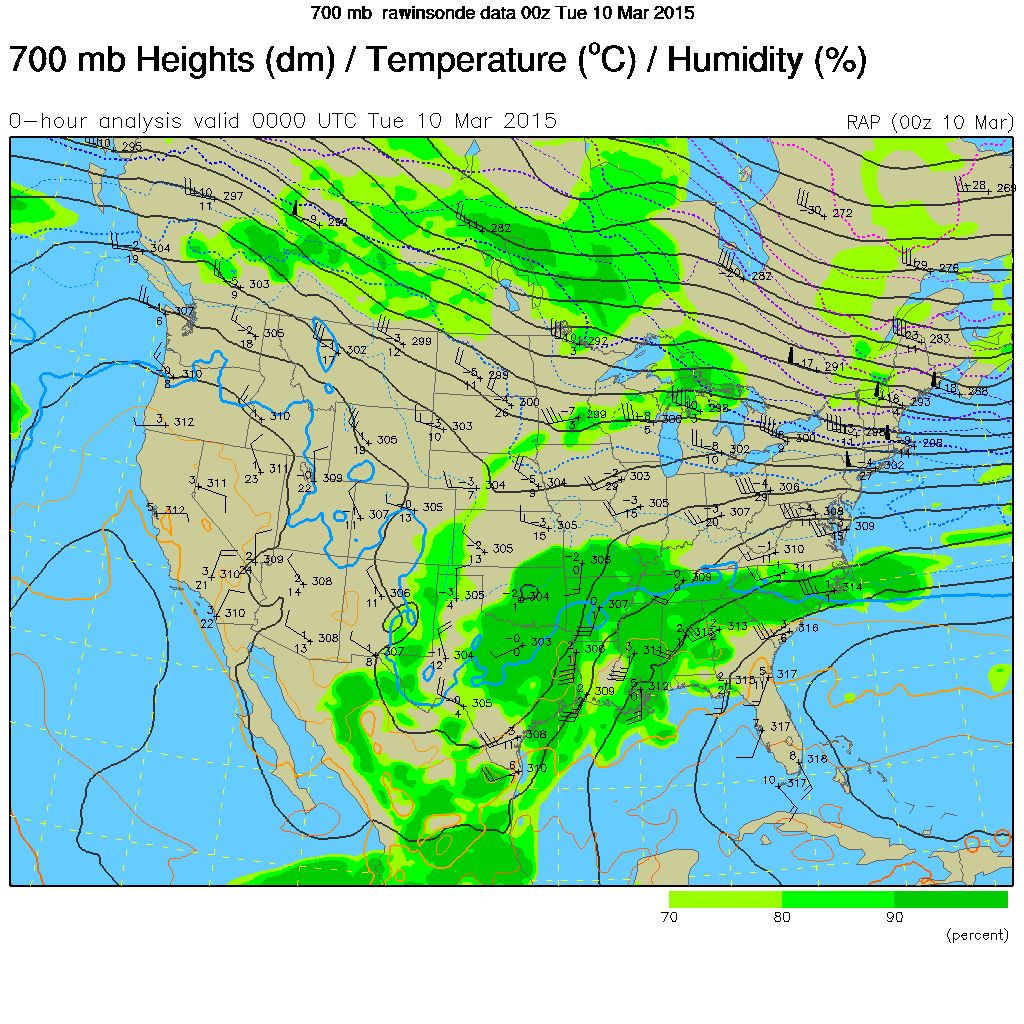
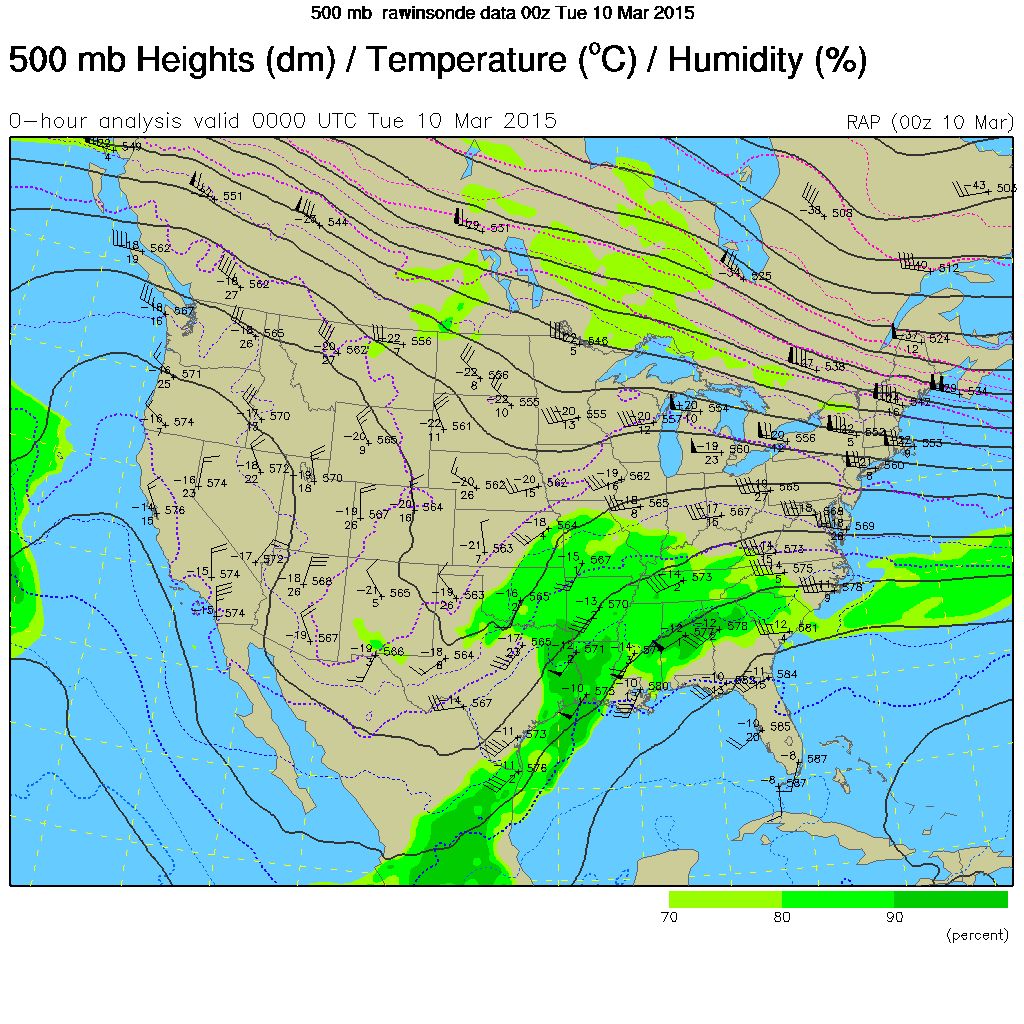
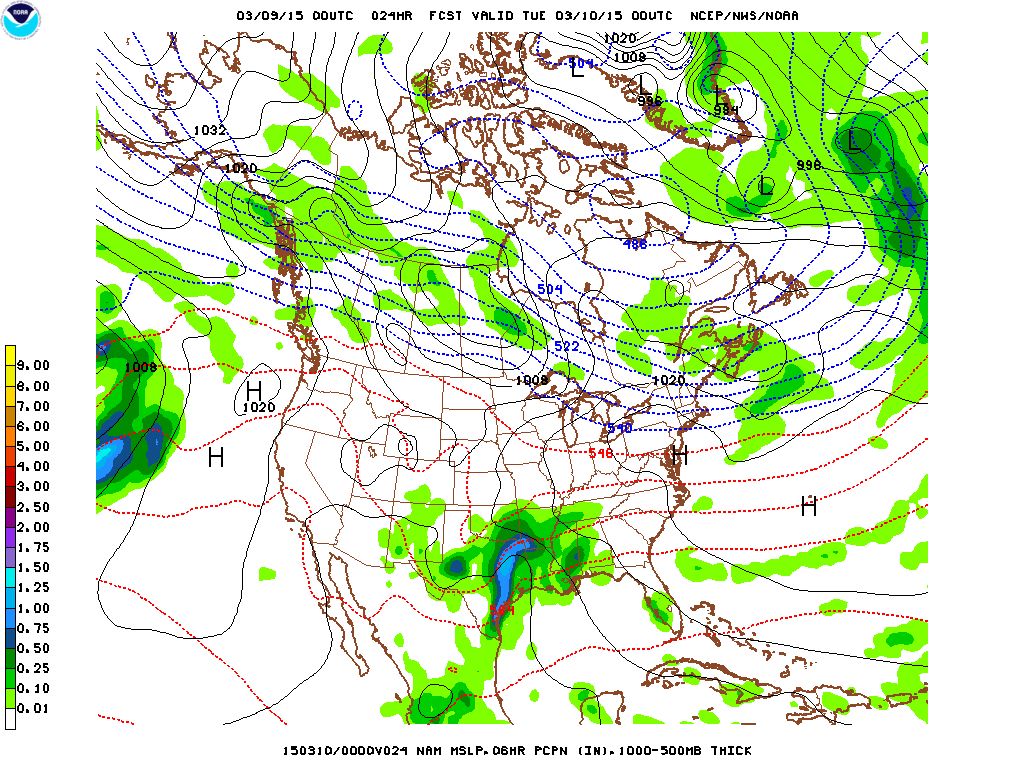
3. For this question, consider the following maps for 00Z March 10, 2015: The MSLP (surface) map, the 925 hPa map, the 850 hPa map, the 700 hPa map, the 500 hPa height map, and the 500 hPa vorticity map. You also have PowerPoint loops of the U.S. radar and U.S. IR satellite.
The MSLP map shows a weak Low in east Texas with fronts. There is a strong line of echoes in southern Mississippi. Call that area 1. The radar also shows a large precipitation area along the Texas-Louisiana border, extending as far north as the Missouri border. That is area 2. Finally, numerous small but strong echoes are in eastern New Mexico. Call that area 3
a. ( 5%) On the 24-hour surface forecast map, the station NNE of the Low, where it is raining moderately, is KGGG (Longview, TX in Gregg county). There is a dotted red line right through the location of KGGG. What does that dotted line mean and what is its value? Include the units.
b. ( 16%) What are the causes of upward vertical motion for the three precipitation areas described above? You may have more than one cause for vertical motion for any of the three areas. Your answers must be consistent with the maps given and you must identify which maps you used to find each of the vertical motion causes.
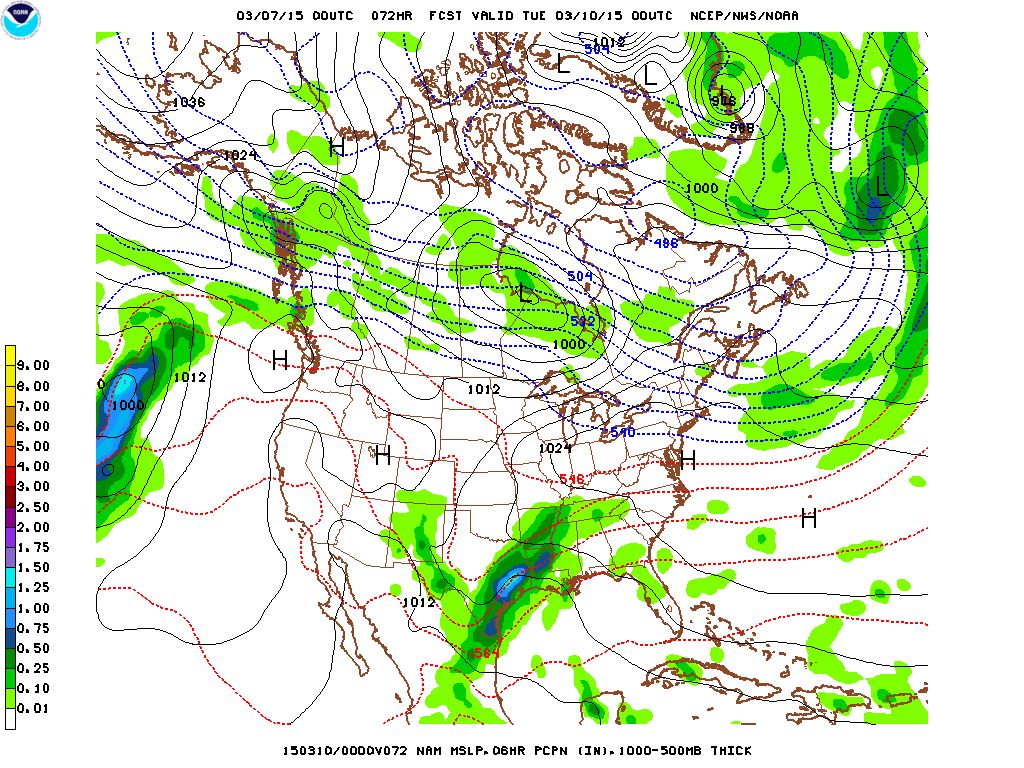
c. ( 10%) MSLP forecasts made by the NAM (initialized on different days) are the 24 hour and 72 hour forecasts. Both are valid 00Z on March 10, 2015. Looking only at area 2, the forecast precipitation is very different. Using the other parameters on the MSLP forecasts, what was different at 24 hours and 72 hours that could have explained the different forecasts? (Hint: the differences on the other forecast parameters is not spectacular. Look hard).