|
run #
|
date run |
rainfall rate (m/s)
|
uplift rate (m/s) |
grain size (m)
|
kaolinite wt.%
|
total base level fall (cm)
|
rainfall mass rate (mg/cm^2
/s)
|
uplift mass rate (mg/cm^2
/s)
|
mass rate forcing ratio (r/u)
|
|
3
|
7/99 |
6.1
|
6.02
|
45
|
1
|
82.9
|
6.08
|
10.23
|
0.59
|
|
2
|
10/98 |
3.86
|
2.82
|
45
|
1
|
84.83
|
3.85
|
4.79
|
0.80
|
|
1
|
7/98 |
3.8
|
2.16
|
45
|
1
|
43.75
|
3.79
|
3.67
|
1.03
|
|
5
|
5/00 |
14.5-16.3
|
1.47
|
45
|
1
|
81.43
|
16.25
|
2.50
|
6.50
|
|
5(last part)
|
6/00 |
16.3
|
1.47
|
45
|
1
|
15.9
|
16.18
|
2.5
|
6.50
|
|
4
|
9/99 |
6.2
|
0.55
|
45
|
1
|
88.1
|
13.46
|
1.60
|
6.61
|
|
6
|
7/00 |
13.5
|
0.94
|
45
|
1
|
88.85
|
16.25
|
0.94
|
8.42
|
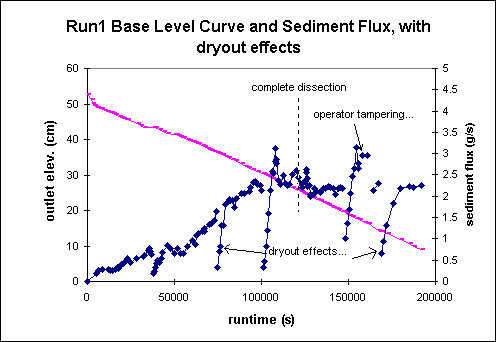
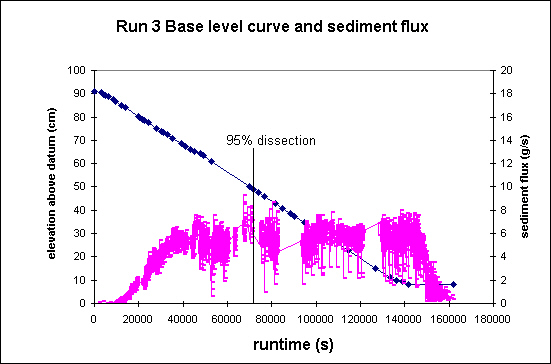
Below are the diagrams for base level curve, and measured sediment and water fluxes at the outlet to the basin. The water flux signal contains information on both rainfall/runoff and water contained in the substrate pores (groundwater).
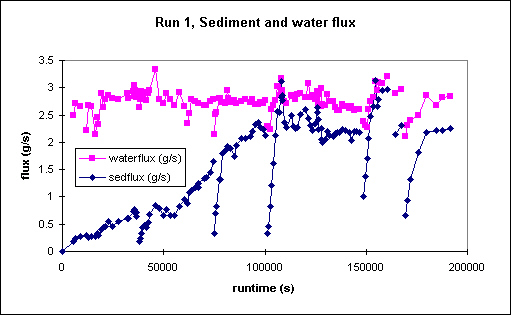
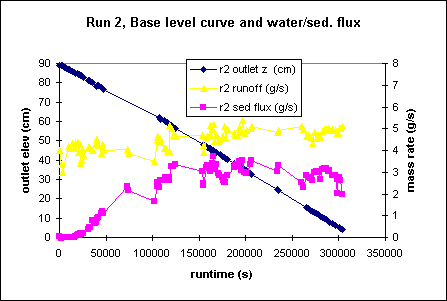
I collected measurements of sediment and water flux for runs 1 and 2 by catching effluent at the outlet of the basin in a hand held calibrated cylinder, recording the time required to fill the cylinder, then measuring the mass and volume of the effluent. The method works o.k., but I noticed a fair amount of noise in the sediment flux, so I automated the collection process to capture measurements nearly continuously through the run (these runs last for days, and I just couldn't stay awake to sample in the wee hours...).
The sediment flux signal is really noisy for this run! This is the first run that I had an automated sediment flux monitoring device in operation, and unfortunately was not too familiar with its limitations. This run had the lowest r/u value, which means that a lot of sediment had to leave the system with not much water. The self activating siphon just didn't like to work when the sediment concentration approached 40-50% of the flow. So I had a constant tank adding additional fluid into the device to help it flush. This signal also appears much noisier because it has not been smoothed as the final three runs have been...
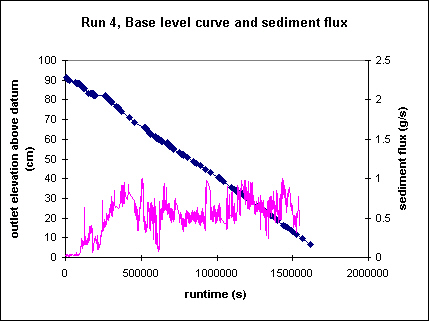
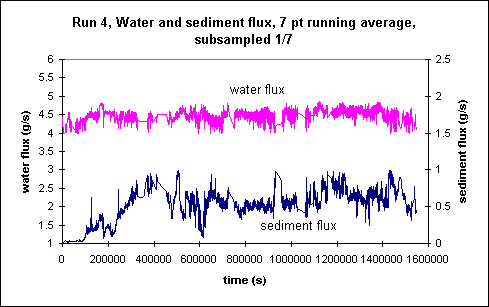
Run 4 is also a bit noisy, but most of the big spikes are problems with load cell wear-and-tear. I installed a new load cell after t=1200000. The large drops in flux after that time are calibration times using clear water, and do not correspond to erosional quiescence. The large peak after 1400000 is a real perturbation to the system. A chunk of angle iron was inadvertently knocked into the tank late one night by the operator (Les Hasbargen), spearing into the substrate. Upon extraction, the substrate began to flow, with a consequent loss of relief in ~25% of the basin. Normal oscillations that can be expected at constant forcing can be seen around time 800000. This is the section I subsampled to get the steady state sediment flux coefficient of variation. The water flux looks fairly constant.
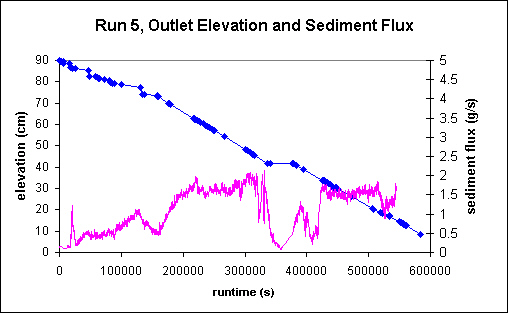
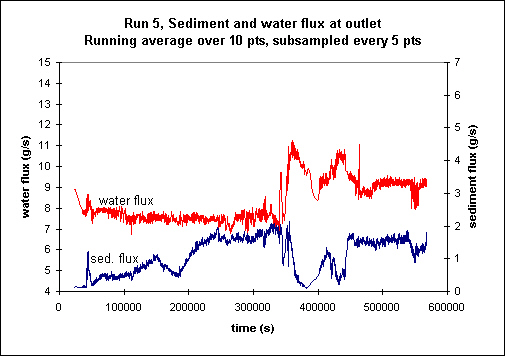
Run 5 started off well, but the rainfall was shutoff in mid-run by an innocent bystander, and the outlet continued to drop. After this perturbation (340000), I let the landscape erode at a fixed base level, then started the outlet around 375000. Unfortunately, another experiment in the lab caused large fluctuations in the water pressure, and then was shut off around 460000. From that time on, things look quite stable. I utilized data from the latter portion of the run.
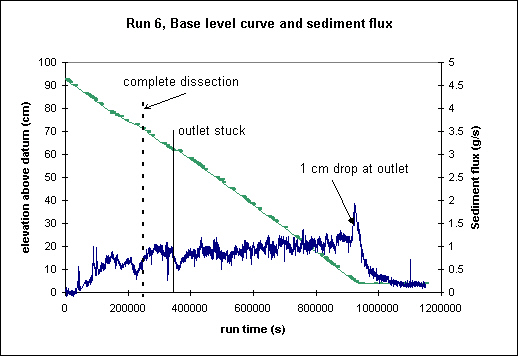
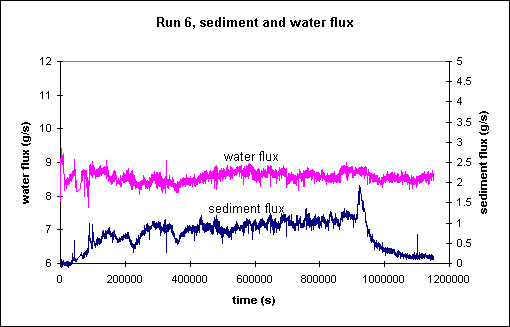
Aside from some initial stick-slip behavior in the sliding gate outlet, this run behaved pretty well. There is a general increase in the sediment flux noticeable from about 500000 on, which is tracking a slight increase in substrate density with depth
page last modified June 11, 2001 by Les Hasbargen.