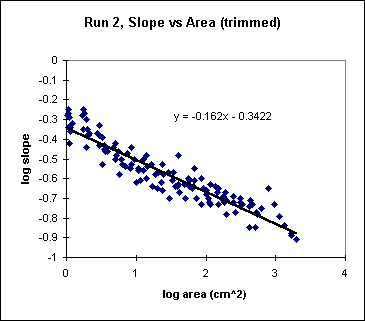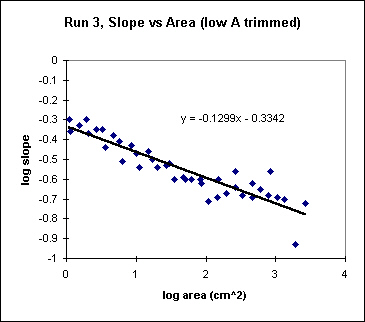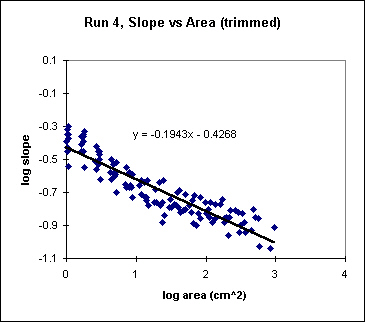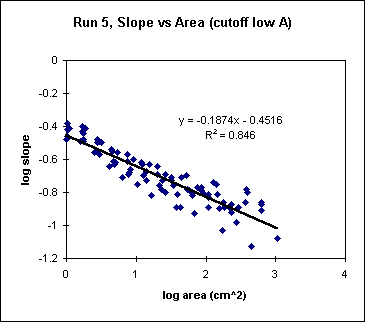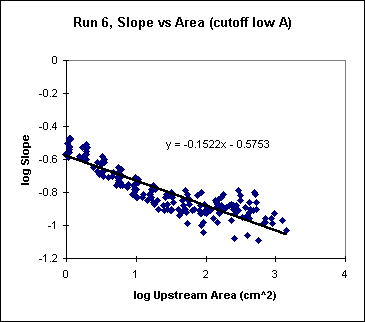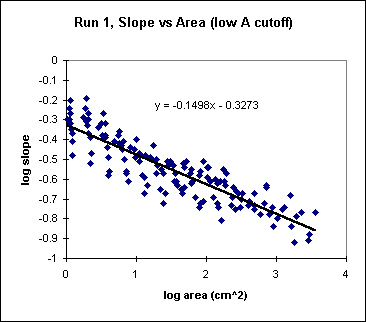
The smallest contributing area has been removed from the plots below. Slope decreases at the smallest contributing area (0.49 cm^2, grid spacing is 7 mm). I also filtered some of the data at the largest contributing areas, because of slope increase. I certainly note the same kind of noisy plots that other researchers have demonstrated for natural drainage basins. I felt justified in filtering the high end area data because 1) they represent a very minor fraction of the total distribution (<1%); 2) increased slopes could easily be due to gridding artifacts, poor correlations from automated image correlation resulting in implausible elevations, or they could be real, and represent oversteepened sections in streams (knickpoints). I have not rigorously tried to locate these anomalies on photographs...Otherwise, the exponents (the coefficients in the regression equations) all range from -0.13 to -0.19, pretty much out of the range of natural alluvial rivers (-0.4 to -0.8, Lague, 2000), but not that dissimilar from reported exponents for badlands (-0.19, Howard and Kerby, 1983). Other researchers working with small scale experimental drainage basins report rather low exponents as well (Lague, -0.11, poster session, 2000; Hancock, -0.02 to -0.28, 1997). This could be the significant morphologic difference between microtopography and larger scale drainage basins. Experimental streams (laminar flow in my experiments) may not have the umphfff!! of their turbulent counterparts. Perhaps we need to run our experiments in slightly larger tanks, like Chris Paola's subsiding basin...Note the intercept in the regression equations is lower for runs 4-6 (lower uplift runs), from a slope ~0.45 to ~0.27 (intercepts -0.33 to -0.57), suggesting lower local slopes for lower uplift rates.