 Biochemistry (Chemistry 330)
Buffers and Titration
This page contains some theory on buffers, a procedure
for titrating water and a buffer
to show the difference, and a procedure for titrating a zwitterion
like an amino acid. An appendix
is available with help on pH, logs and the pH
meter. You can also leave me a message, go to
my home page, or go back to the lab
schedule.
The mechanism by which the pH is maintained in
biological systems is through buffers - chemical substances which resist
changes in the pH of the solution. They do so by reacting with added acids
or bases to remove H+ ions or add them to the solution, such
that a much smaller change in pH occurs than would have without the buffer's
presence. This is possible because buffers are themselves weak acids
or weak bases (or both as in amino acids) which ionize or are protonated
under these conditions. Human blood contains several buffering systems,
among them the bicarbonate/carbonate system and the phosphate system, to
maintain the pH
around 7.4. If the pH is altered ± 0.4 pH units, death follows
rapidly.
To see the effect a buffer has on pH changes, first add small aliquots
(e.g. samples, amounts) of a strong base to water without a buffer present.
Then, repeat this process (titration) with a weak acid in the water.
A plot of both sets of pH data on the same graph illustrates the point
dramatically.
Would you like to go to the top
of this page, to my home page, or back to the
lab
schedule?
Procedures: Titration of H2O
and a buffer with NaOH

|
-
Standardize the pH meter to read accurately between pH 7.0 and 4.0 (see
pH
Meter). Rinse and fill a buret with NaOH or KOH. (Record the concentration!)
-
Arrange a beaker with a stir bar and 30 mL of distilled water (dH2O)
on a magnetic mixer.
-
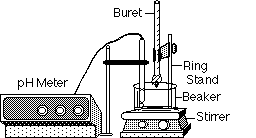
Arrange the pH meter probe
in the beaker and clamp a buret containing the strong base over it, as
shown here.
-
Read and record the pH of the water. Will it read 7.0? Why not?
|
Be sure the beaker is large enough to contain the total volume likely
to be generated at the end of base addition.
-
Rapidly rotate the stopcock a half turn, once or twice, to add about 0.1
mL of base to the beaker.
-
Stir, and record the volume of base delivered and the pH again.
-
Repeat until the pH change is minimal (about pH = 11). This process is
called titration.
-
If desired, plot the pH values on the ordinate (y-axis) and total mL of
base added on the abscissa (x-axis) on graph paper or on a computer.
To determine how a buffer differs, titrate a weak acid
with the base and plot both results together.
-
Titrate 30.0 mL of a weak acid like acetic acid (about 0.1 M HAc) with
base as above.
-
Start with small (0.1-0.5 mL) additions; use larger (1.0-5.0 mL) additions
when the pH changes are minimal (from about 2 to 25 mL, total, if acid
and base concentrations are similar), and end with small additions again.
-
The end point should be obvious from the rapid jump in pH readings, but
stop when the pH reaches 10 -11.
-
Plot your pH vs. mL NaOH data on the same graph as the NaOH vs. H2O
test.
Would you like to go to the top
of this page, to my home page, or back to the
lab
schedule?
An amino acid is a molecule with at least two ionizable groups (a
zwitterion), one acidic (-CO2H ---> -CO2¯
+ H+) and one basic (-NH2 + H+ ---> -NH3+).
To titrate such a solution:
-
Recalibrate
the pH meter between 7 and 10, and titrate 30 mL of a 0.1 M amino acid
like glycine with 0.1 M NaOH. How much NaOH will be required?
-
Again use small, large, then small additions, and stop after adding at
least the same volume of base as you had glycine (pH ~ 11). Why?
-
Recalibrate the pH meter between 7 and 4, and titrate another sample
of glycine with 0.1 M HCl, stopping at pH ~ 1.5, if more HCl than glycine
was added.
-
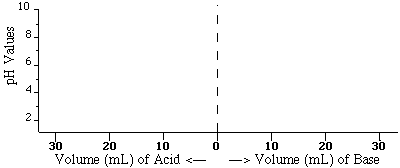
Plot both sets of data on the same graph with pH on the ordinate
(y-axis) and mL of acid to the left of 0, and mL of base to the right on
the abscissa (x-axis) as shown below.
Example: 0.1 M glycine w/ 0.1 M HCl or NaOH

Would you like to go to the top
of this page, to my home page, or back to the
lab
schedule?
If you have questions or comments, write the:
Author of this page: Terry Helser - helsertl@oneonta.edu
Web Coordinator: Philip S. Bidwell - bidwelps@oneonta.edu
Or return to the SUNY @ Oneonta Home Page to see where we live and work.
Last Modified on 7/6/06 

![]()
![]()