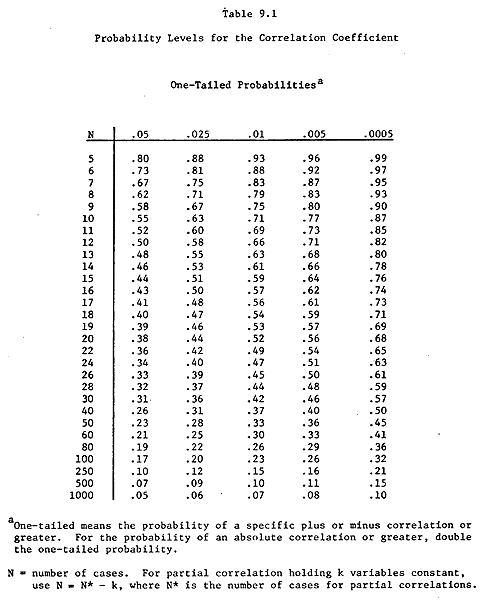
Statistical significance of correlations
The chart below shows how large a correlation coefficient must be to be statistically significant.
The chart shows one-tailed probabilities, so multiply the probabilities along the top row of the chart by 2 to get 2-tailed probabilities. In other words, the columns labeled .05, .025, .01, .005, .0005 (for one-tailed probabilities) should be changed to .10, .05, .02, .01, and .001 (for two-tailed probabilities). For our purposes, we will always be using two-tailed probabilities.
Here is an example of how to read the chart. Suppose you have 25 participants and have found a correlation of .44. You try to find a row for 25 participants, but there is none. There are only rows for 24 or 26 participants. You look on the line labeled 24 participants (since you do have at least 24 participants, but you do not have at least 26 participants).
After finding that row, look across the table. Read the numbers this way: to get a one-tailed statistical level of .05 (two-tailed .10) you need a correlation of at least .34. For a one-tailed statistical significance level of .025 (2-tailed .05) you need a correlation of at least .40. And so on.
Reading this way you will see that your correlation of .44 is significant at the .025 (one-tailed) level, which is .05 two-tailed. Therefore you will say this in your report. "The correlation between ___ and ___ was .44, which was statistically significant (p<.05)."
If you had 20 participants and a correlation of -0.53, what could you say?
If you had 14 participants and a correlation of .49, what could you say?
If you had 10 participants, what correlation would you need to have in order for it to be significant at the .01 level (two-tailed)?