METR
360
Fall, 2016
Exam
1
Directions:
Answer all parts of all questions in the blue
books or write a text file which you may e-mail to Jerome.Blechman@oneonta.edu. For
calculations, show
all work. You may use any source, including your notes, any
textbook or
the Internet. You may NOT talk (or text) during the exam, except
to
me. Raise your hand if you have a question.
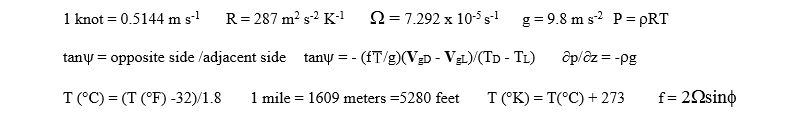
The following
information may (or may not) be useful:
1. On September
25, 2016 at 00Z, the surface map showed a variety of symbols.
You
have a printed color map of this.
a. (5%)
Find a station where the computer’s isobar analysis is clearly
very wrong (not
just a judgement call), circle it, and briefly explain how it is wrong
(there
are at least three of these. You just need one).
b. ( 12%)
You also have a Day 5
forecast
for 12Z Sept 30. Based on this forecast map make a forecast
for Key
West that would be consistent with the Norwegian Model. Your forecast
is ONLY
for 12Z Sept 30, not the full WxChallenge day. Forecast just the
temperature, wind direction, and precipitation type that is consistent
with
this map at that time. Explain your choices.
2. This question refers to the surface map loop for March 1-2, 2016. The loop is an Excel presentation. To see the maps move, advance the slides manually. You may use any Excel feature on any map to see it better in any way.
a. ( 3%) On the initial map (03Z, March 1) there is a Low pressure center on the border of northeast Kansas and southeast Nebraska. The northwest tip of Missouri is also there. What Norwegian Cyclone model stage is this Low? Just name it.
b. ( 3%) Also on the 03Z March 1 map, there is an orange scalloped line in western Texas. This type of line was not part of the Norwegian Cyclone model as proposed by Bjerknes and Solberg. What is it?
c. ( 3%) At 15Z a red dash-dot line appears in the warm sector in Indiana and Kentucky. This is also not part of the original Norwegian Cyclone model. Name that feature as well.
d. ( 4%) At 06Z on March 1, there is a warm front in the southern Mississippi valley. What happens to that warm front in the following six hours? Use the meteorological term for that process in your answer.
e. ( 6%) Make a case that the surface map analyst made a mistake with what happens to the Mississippi warm front. Your case must rely on the weather shown in the loop.
f. ( 6%) On the blank U.S. base map supplied, sketch a likely map for 09Z March 2 which would be the next map in the loop. Your map must conform to the Norwegian Cyclone Model. Draw H's, L's, and fronts. Use the proper symbols.
g. ( 7%) A closeup plot (no fronts shown) of the observations at 06Z on March 1 is provided. Based on the data shown, calculate the slope of the cold front that we know lies across the middle of this map. Estimate the quantities you need from the maps given, except for TD – TL which is -1K. Show all work.
h. ( 6%) Based on the maps given and Margules formula, assess the strength of the cold front through central Illinois and Indiana. Give two reasons for your assessment.
3. This question refers to soundings from KBUF (Buffalo) and KXXX (an unidentified station in the U.S.) from 00Z on September 25, 2016.
a. (9%) You have a printed version of the KXXX sounding. On that paper, mark a place where the temperature sounding is absolutely unstable, one which is absolutely stable, and one which is conditionally unstable.
b. (4%) For the conditionally unstable section of the KXXX sounding that you marked for part a, what is the condition which would render the sounding unstable and is that condition satisfied on this sounding?
c. (4%) To the right of the KXXX sounding are the winds. One wind is circled in red. What is the wind direction and speed in the proper U.S. units (degrees and knots)?
d. ( 6%) Based on the sounding and the U.S. surface map you have, in which state is KXXX and where is it within the state (north, south, east, west, central)? Briefly list your reasons for picking that location and state.
e. ( 4%) Describe the likely sky conditions as seen from Buffalo at 12Z on Sept 24, 2016.
f. ( 4%) What is the warmest temperature anywhere on the KBUF sounding? In the upper air code that would have reported it, was your warmest temperature in the TTAA or TTBB section?
g. ( 6%) For your temperature answer to part f, what would be the TTTaDD reported, using the proper code?
h. ( 8%) A meteorologist could tell from the KBUF sounding that a front is lying some distance to the south. The 00Z U.S. surface map confirms that. What feature(s) can be found on the KBUF sounding that allow this correct deduction to be made? Briefly explain how your feature(s) would do that.
![]()
![]()
When you are done, raise your hand and I’ll come to pick up your maps from questions 1a and 3a. Put your names on them and on the question page.