|
A note on the flooded areas... |
|
I took
USGS Digital Elevation Models (DEMs, usually the 1/3 arc second spacing data
from the USGS Seamless Server), and overlaid National Aerial Imagery Program air
photos (1 m spatial resolution, color, flown in 2005-2006) on to the
topography in Global Mapper, a GIS software. Then I flooded the area to the
height recorded on the local USGS gage, or to estimated heights based on
ground based surveys and photos and/or air photos taken of flood damage. Spatial
data in the form of aerial photographs, topography, and maps represent a very
convenient and powerful tool for characterizing flood extents. However, there
are significant limitations. Spatial data available online are usually not
detailed as much as we would like. Topography data typically have an
elevation value every 30 to 90 feet. See the USGS site describing DEMs here. Air
photos are higher resolution, at 1-3 ft spacing, but it is the uncertainty in
elevation values which can lead to mis-mapping of flood height extents. While
every effort has been made to faithfully represent flooded areas, the results
nonetheless must be treated as "ball park estimates". The images
contained in this site should not be used for construction, planning, or
engineering purposes, etc., as the underlying data sets have large
uncertainties in location of flood heights due to the limitations of
elevation maps. If you
have photos which better document flood heights, or can otherwise provide
information on flood heights for your area (if you live in Delaware or Otsego
Counties, NY), please contact me (Les Hasbargen, SUNY Oneonta Earth Sciences,
hasbarle@oneonta.edu), and I will do what I can to add your data to the site. |
|
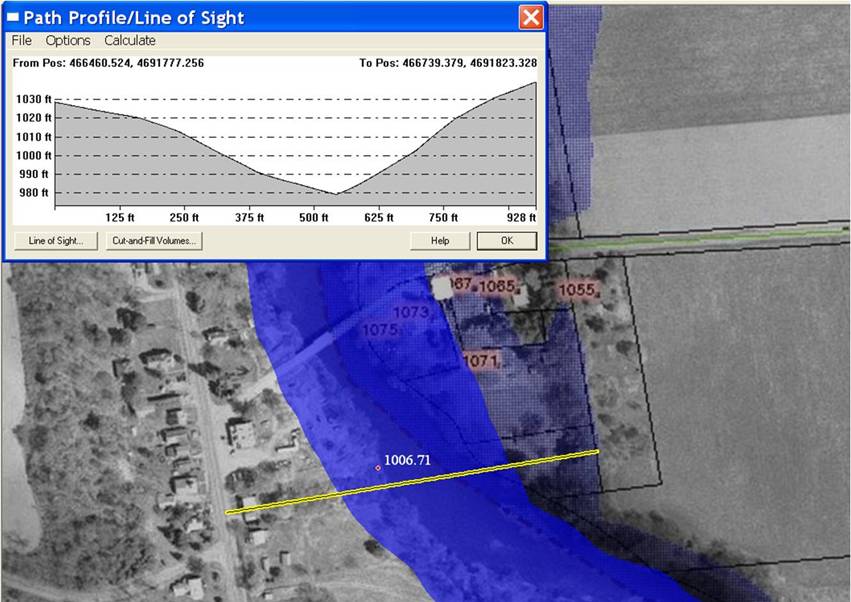
The
image above at Rockdale, NY on the Unadilla River compares the flooded region
given by the Otsego County map of flooded areas (stippled blue) vs the flood
elevation based on the USGS gage elevation (lighter uniform blue) of the peak
flow and then flooding the area to this elevation. The USGS gage gives
1006.71 feet as the topographic elevation of the flood, whereas the mapped
flood area (stippled blue region) gives the elevation as closer to 1040 ft
(both as height above sea level). This is about a 30 foot discrepancy in
flood height. The topographic profile of the inset chart corresponds to the
yellow line across the Unadilla River.
The highest part of the profile corresponds to the flood height the
Otsego County map would rise to. Note that the Otsego County flood map stops
at the county line, in the center of the Unadilla River. Thus caution must be
used when using flood maps. Part
of the reason for developing yet another
site for flood mapping is to provide for select locations new data that place
better constraints on flood heights. This site is not meant to replace the Dartmouth or Otsego County sites, but to
supplement them. |
|
Page maintained by Les Hasbargen:
hasbarle@oneonta.edu This site is in a stage of active
development, so expect changes in the coming months. |