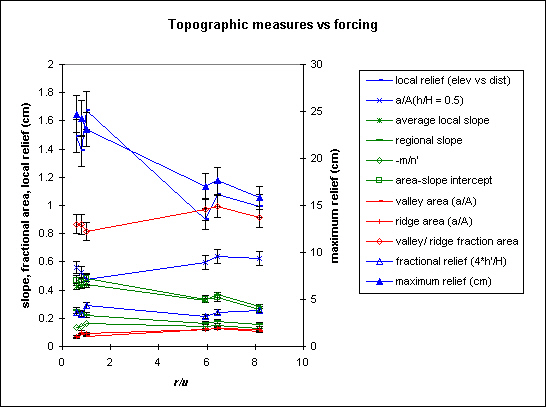
Chart 1, Geomorphic measurements vs the forcing parameter, r/u (rainfall rate / uplift rate)
The statistics (elevation stats in blue, slope stats in green, fractional ridge and valley area in red) have been calculated as follows:
1) Local relief (cm), and fractional relief (cm/cm). We calculated the average and standard deviation of elevation as a function of distance from the outlet for all elevation sets for each run. Local relief is the average deviation (h'), and fractional relief is the average deviation (h') divided by the maximum relief (H), multiplied by 4 (essentially the 2 sigma range in local elevation). Absolute local relief, (expressed in cm) appears to be sensitive to forcing. Fractional relief, however, exhibits no systematic change. This result is a little puzzling. It suggests that local roughness (or the transverse relief) is always a constant fraction of the total relief, ~ 25%. This may be a useful statistic for comparing sandbox landforms to natural landscapes.
2) a/A (h/H = 0.5) This stat is the average value of a/A on the hypsometric curve at h/H = 0.5 for the set of curves for each run. Stated verbally, it is the number of points above the mean elevation. There's not much of a slope to the line through the points, but it looks like the number of points above mean elevation increases slightly for higher r/u, suggesting that the center of mass of the basin moves toward the outlet to the basin for higher r/u.
3) Average local slope. This is the average steepest descent slope.
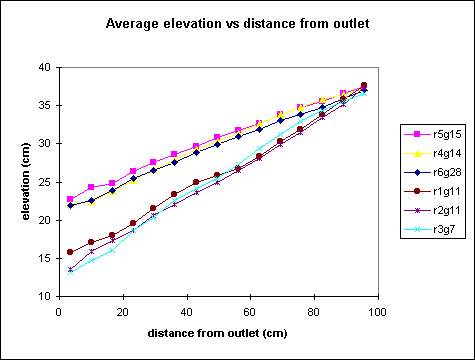
4) Regional slope. We plotted average elevation vs distance from the outlet, and fit a linear profile through the plot. Regional slope is calculated as the average of the slopes of the linear plots. Elevation vs distance plots appear mostly linear, but some have a minor convexity to the them.
5). -m/n' and area-slope intercept. We plotted the average slope against the average contributing area to a point (in log space), and determined the slope and intercept of the line. The slope of the line is the exponent in a power law relationship between average slope and contributing area, and the intercept corresponds to the slope at the unit area, in this case, a 1 cm^2 cell. The area-slope intercept closely tracks the average local slope derived from local slope distributions. Values for -m/n' for our data show that the relation between contributing area and slope is weakly nonlinear (values are ~ 0.15) , and does not appear to be sensitive to forcing conditions.
6) Maximum relief, calculated as the average maximum elevation range after complete dissection of the surface.
7) valley and ridge fractional area, and the ratio valley/ridge. Valley fractional area (number of cells with values < 0.3, divided by total number of cells in elevation grid) is a proxy for drainage density (total stream length divided by basin area). We calculated this statistic using a local elevation ranking (I call it 'local relative height') algorithm. We passed a moving 5 x 5 window through a gridded elevation data set (7 mm grid spacing), and counted the number of cells in the window lower than the center cell, and divided this number by the total number of cells in the window (area = l x w - 1). Hence, possible values range from 1 to 0 in 0.04 increments (for a 5 x 5 pixel window). This algorithm highlights local highs and lows. Gray scale plots of these values can be viewed under the 'ridge animations' section (more on local relative height here). We calculated the frequency distribution (15 bins) for elevation fields transformed with this algorithm, then summed the frequency distribution (normalized to total number of cells) with values between 0 to 0.3 to get the fraction of the basin area occupied by cells with > 70% (lows, or valleys) and < 30% (highs, or ridges) of their neighbors being higher. Valley/ridge area appears to be constant. From chart 2, valley area is sensitive to uplift rate, and from chart 3, valley area is insensitive to changes in rainfall rate.
Obviously, slope and maximum relief are sensitive to the forcing parameter r/u. Note, the error bars represent 8% variation (standard deviation / mean) in the measured variables.
We also present the same statistics plotted vs uplift rate and rainfall rate (Charts 2 and 3 respectively). Slope and relief increase with uplift, but only to a limit. I think this limit is set by the strength of the substrate, and marks the onset of hillslope failures playing a major role in eroding the landscape. Slope and relief decrease with increasing rainfall.
Chart 2, Geomorphic measurements vs uplift rate
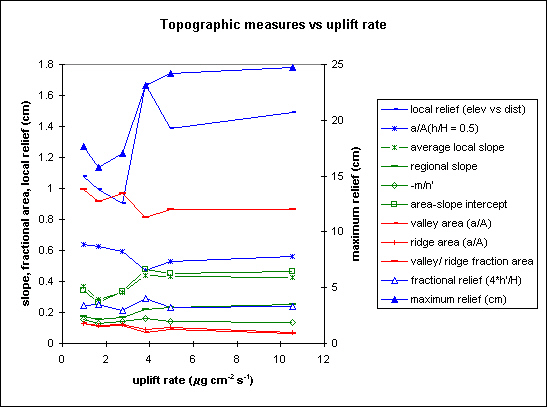
Chart 3, Geomorphic measurements vs rainfall rate
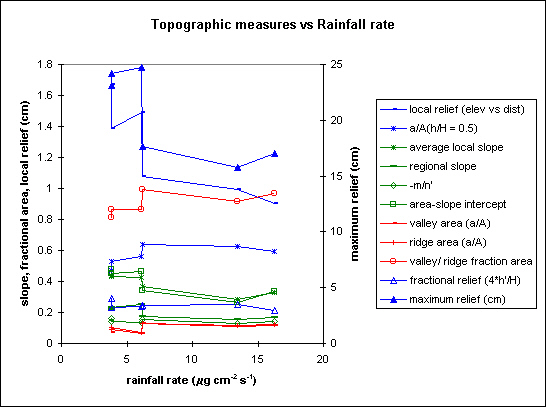
Chart 4 Selected measures plotted against forcing
.jpeg)
page last modified October 13, 2001 by Les Hasbargen