|
|
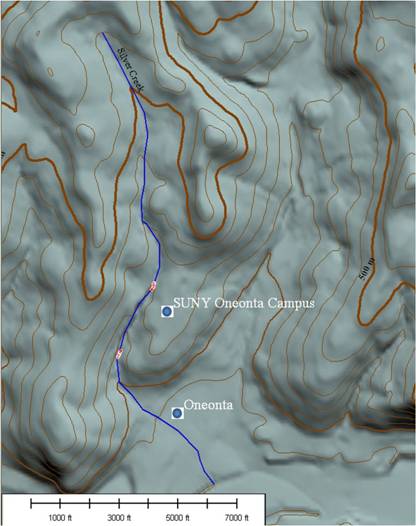
Silver Creek, next to SUNY College at Oneonta,
New York |
|
Back to 2006 Flood Introduction SUNY Oneonta home Otsego County’s June 2006 Flood
Data, with flooded areas for the main valleys, road closures, etc. Dartmouth’s
flood map for the 2006 flood |
Map
of Silver Creek, nestled against the SUNY Oneonta campus in Oneonta, NY.
North is “up”. Elevation
data to create the map derives from the National Elevation dataset (30 m
spacing). UTM
projection. Red dots on Silver Creek mark survey locations for channel cross
sections below.
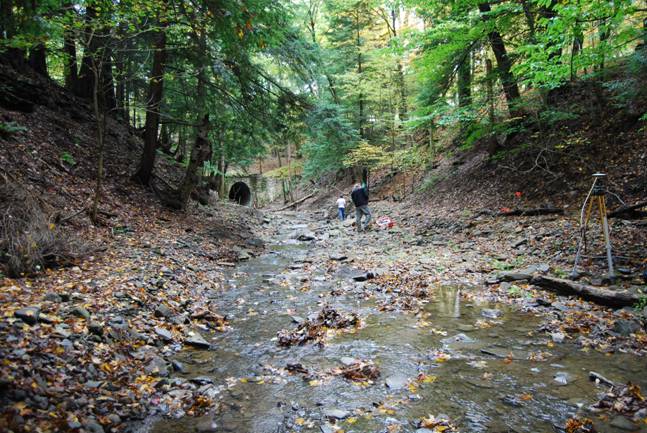
Setting
up a survey in Silver Creek, with Tyson Robb and Tony Grimes, students at
SUNY Oneonta. Note
the cobble terrace on left and right sides of the channel. We used this as a
conservative estimate
of the flood height through this section of the stream.
Map
of surveyed cross sections in Silver Creek, near the entrance to SUCO campus
at West and Ravine Parkway.
North is “up”. Grid spacing is 10 meters. Green triangle and brown square
mark GPS stations. Two
southwest points rest on the culvert beneath Ravine Parkway, visible in photo
above.
The
two cross sections above show the channel shape and flood height (horizontal
blue line) at two locations along
Silver Creek, separated by about 60 m (~200 feet). No tributary enters the
channel between these two locations,
so each section experienced the same discharge. Because the bedrock floored
channel is so much smaller, the
velocity must have been much greater at this section than the alluvial
(cobble/boulder covered) section. This is a
“roughness” effect. Greater roughness slows the flow, so the cross section
area increases to transmit the same discharge. Note,
the bedrock here is smooth, relatively flat-lying sandstone, moderately
resistant to erosion, and typically breaks into
large plate-like boulders when eroded from the bed of the channel.
Reconstructing
flood surfaces is a major aspect of this project. Can it be done long after
the flood has
receded? At each of the above cross sections, we could find some evidence of
high water. From these, we
reconstruct the flood surface. We chose the highest mark for each cross
section. The blue line in the figure above
represents the flood surface. Straight line regressions have been fit to both
the floor of the channel and
the flood surface as general approximations of each. Clearly, flow depth
increases downstream. This
occurs at the bedrock to alluvial transition. We can determine water surface
slopes for the flood surface, and,
coupled with flow depth, we can estimate shear stress exerted on the bed of
the channel. Thus, we
estimate the size of boulders that the flood could move. This work is
ongoing. |
|
Data source for flood
height: Total station survey of flood debris (woody debris, imbricate
boulders, top of gravel bars) and channel shape by Les Hasbargen, Tyson Robb, Anthony Grimes,
and Roy Widrig. |
|
|
Page maintained by Les Hasbargen:
hasbarle@oneonta.edu |
|
