|
|
Documenting
the Summer 2006 Flood in
Otsego County, New York |
|
Overview |
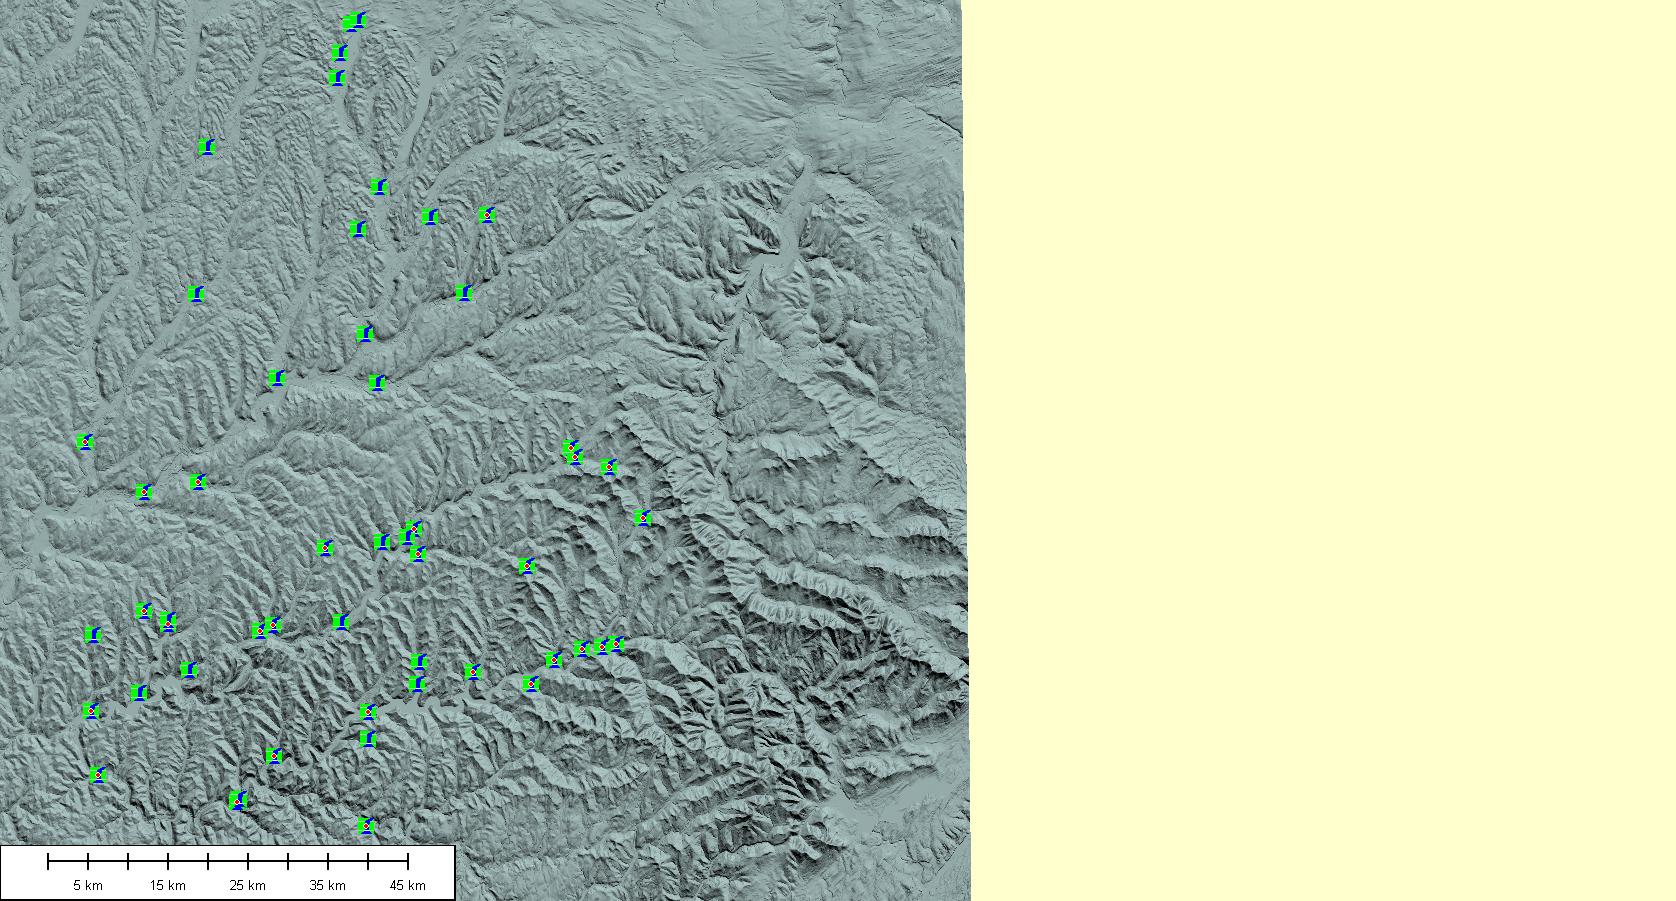
Shaded Relief Map of the
Upper Susquehanna Basin: stream gages (blue-green icons) that were active in
2006 have a red dot (most gages in Otsego County were decommissioned!) |
|
Data sources |
Introduction to the Flood of 2006 In June 2006, a persistent weather
pattern brought a couple days of intense heavy rain (“training” of rain
storms) to the upper Susquehanna River basin. The result was catastrophic for
many people in the area, as they watched flood waters rise, then rise more.
Flood waters inundated numerous homes, scoured farmlands and ruined crops, and
washed away many highways and bridges. Many channels deposited cobble and
boulder size material up onto their banks, and even onto the flood plain.
Farm fields in places were stripped of crops and topsoil, and in others were
buried under cobbles and gravel. The flood left a lot of debris to mark the
high water line, which is still visible in places (as of February 2009). I arrived in the area in the summer of
2007, and most channels I visited still had some signs from the flood. I
found the transport of larger particles over the banks to be an intriguing
problem, and I am starting a program to: 1)
measure flood heights in as many streams as I can before the evidence fades; 2)
derive water surface elevations from reconstructed flood heights; 3)
document the distribution of cobble and boulder movements during the flood; 4)
get a better grasp on the recurrence
interval of this kind of event, if possible; and 5)
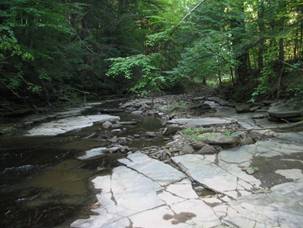
look more closely at flood height and bed roughness, as smooth
bedrock-floored sections of streams clearly had lower flood heights than
alluvial-covered reaches. This falls right in line with how we think
roughness influences stream velocity—namely, rougher beds have higher
friction, which slows down the river, and so floods rise higher to transmit
the same discharge. See our work
on Silver Creek near SUNY Oneonta for an example. |
|
SUNY Oneonta home |
|
|
If
you are interested in imagery of the flood, here
are two places to start:
Here’s
a link to Delaware County’s photo record of the event: http://www.co.delaware.ny.us/flood2006.htm.
You
can purchase a CD photo
journal of the event from Oneonta’s Daily Star. |
|
|
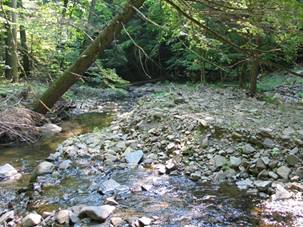
Photo
at right is view downstream of Morris Brook in Otsego County, in Dimmock
Hollow. The gravel bar on the right hand side is fresh, and though hard to
see, flood debris is trapped against the small tree on the right side of the
bar.
|
|
|
|
|
|
|
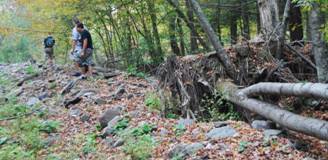
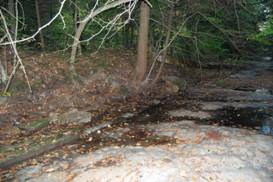
Image at right shows
flood debris and gravel bar on the bank of Morris Brook. |
|
|
|
|
|
Page maintained
by Les Hasbargen: hasbarle@oneonta.edu Initiated in Winter
2008 |
