METR
360
Fall,
2018
Exam
1
Directions: Answer all parts of
all 4 questions in the blue books or write a text file which you may e-mail to Jerome.Blechman@oneonta.edu. For
calculations, show all work. You may use any source, including your
notes, any textbook or the Internet. You may NOT talk during the exam,
except to me. Raise your hand if you have a question.
1. For this
question you have an analyzed
surface map of the northeast U.S., a northeast map with stations plotted but no analysis, and a radar image.
a. ( 8%) There is a line of very strong radar echoes in central Pennsylvania
and New York at 1748 UTC. From the 18Z surface map, which features are probably responsible
for that line? Name them and give reasons for your answer.
b. ( 14%) The station map is from 1916 UTC, not 1816. That’s because the 1816 UTC map had a problem
and had almost no stations on it. One that does appear, YFC is in New
Brunswick, Canada. This is what is shown:
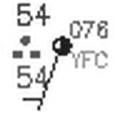
In plain
language not code, report all the weather observations shown for YFC,
together with their observed values at 1816 UTC.
2. For this question, a series of U.S. surface maps has been made into a loop by combining them into a PowerPoint file. You run the “loop” by running PowerPoint and manually stepping through the slides. To go back after reaching the end, you will need to step backward to the first slide. You also have PowerPoint loops of the U.S. Infrared satellite images and the U.S. radar images.
a. ( 9%) On April 3 at 09Z there is a Low that forms in the center of the U.S. At what day and time does that Low reach the following stages of the Norwegian Model? This is not a range. Pick the first time and day the Low gets to each stage:
i. Developing Wave
ii. Mature
iii. Occluded
b. ( 9%) You have a paper copy of the satellite image of the eastern third of the U.S. at 2215 UTC on April 4. On that paper copy write the labels Cold Front, Dry Slot, and Backlash in their proper places.
c. ( 12%) On the first map in the U.S. surface map loop, April 3 at 09Z, Oneonta is marked with a brown filled circle and the designation NYO. On that same map, Nashville, TN is marked with another brown filled circle and the designation BNA. Using any of the information available, report in plain language, what weather BNA would be experiencing. In particular, you must report a temperature, wind direction, and most probable present weather that is consistent with the information you have for 03Z on April 4. Based on the Norwegian Model, briefly explain your choices.
d. ( 12%) Using any of the information available, report in plain language, what weather NYO would be experiencing. In particular, you must report a temperature, wind direction, and most probable present weather that is consistent with the surface map for for these times: 09Z on April 4, 21Z on April 4. Do not explain your choices for this part.
3. For this question, you need the sounding for Green Bay, Wisconsin from 12Z on Sept 15, 2018.
a. ( 12%) On the sounding, find one layer which has a Dry Adiabatic lapse rate, one which is conditionally unstable, and one which is absolutely stable. There may be more than one layer on the sounding that has the characteristics you want. Report only one for each of the three types. To report a layer, give the bottom and top pressures. For example, Absolutely stable: 1050 hPa – 1015 hPa (don’t use that one – I just made it up)
b. ( 8%) Again, using the sounding, determine the 500 mb temperature and dew point. Use those to write the upper air code just for the mandatory level 500 hPa at KGRB on 9/15/18 at 12Z. Assume the height of the 500 mb surface was 5930 meters above sea level (that’s the actual value for that day)
4. Run a PowerPoint loop showing successive 500 mb maps for the landfall of Hurricane Florence, then answer the following questions:
a. ( 6%) You have a paper map of the first image in the loop (00Z on Sep 12). On that map, label the feature that is an upper air trough and the feature that is an upper air ridge.
b. ( 10%) Florence has effects throughout North America as seen on the upper air loop and the NAM MSL and 1000-500 Thickness map loop from September 11-17 (also a PowerPoint for you to step through). Describe how Florence affected the Low coming out of the Rockies, shown in southern Canada, northwest of DTW, Detroit, MI which is marked on both the 500 mb and NAM initial maps. You must connect them in a way that we discussed at the time which is actually shown on the NAM loop. (hint: you now know about Thickness)